
 by
by
Analytics shouldn’t make you argue with your own numbers. Yet that kept happening. A custom event looked like a pageview, a real-time visitor wasn’t actually present, or the useful report sat behind another pricing tier. So I built a Cloudflare analytics tool for the way I manage websites: several properties, one dashboard, live traffic, conversions, and no analytics work pushed onto the WordPress server.
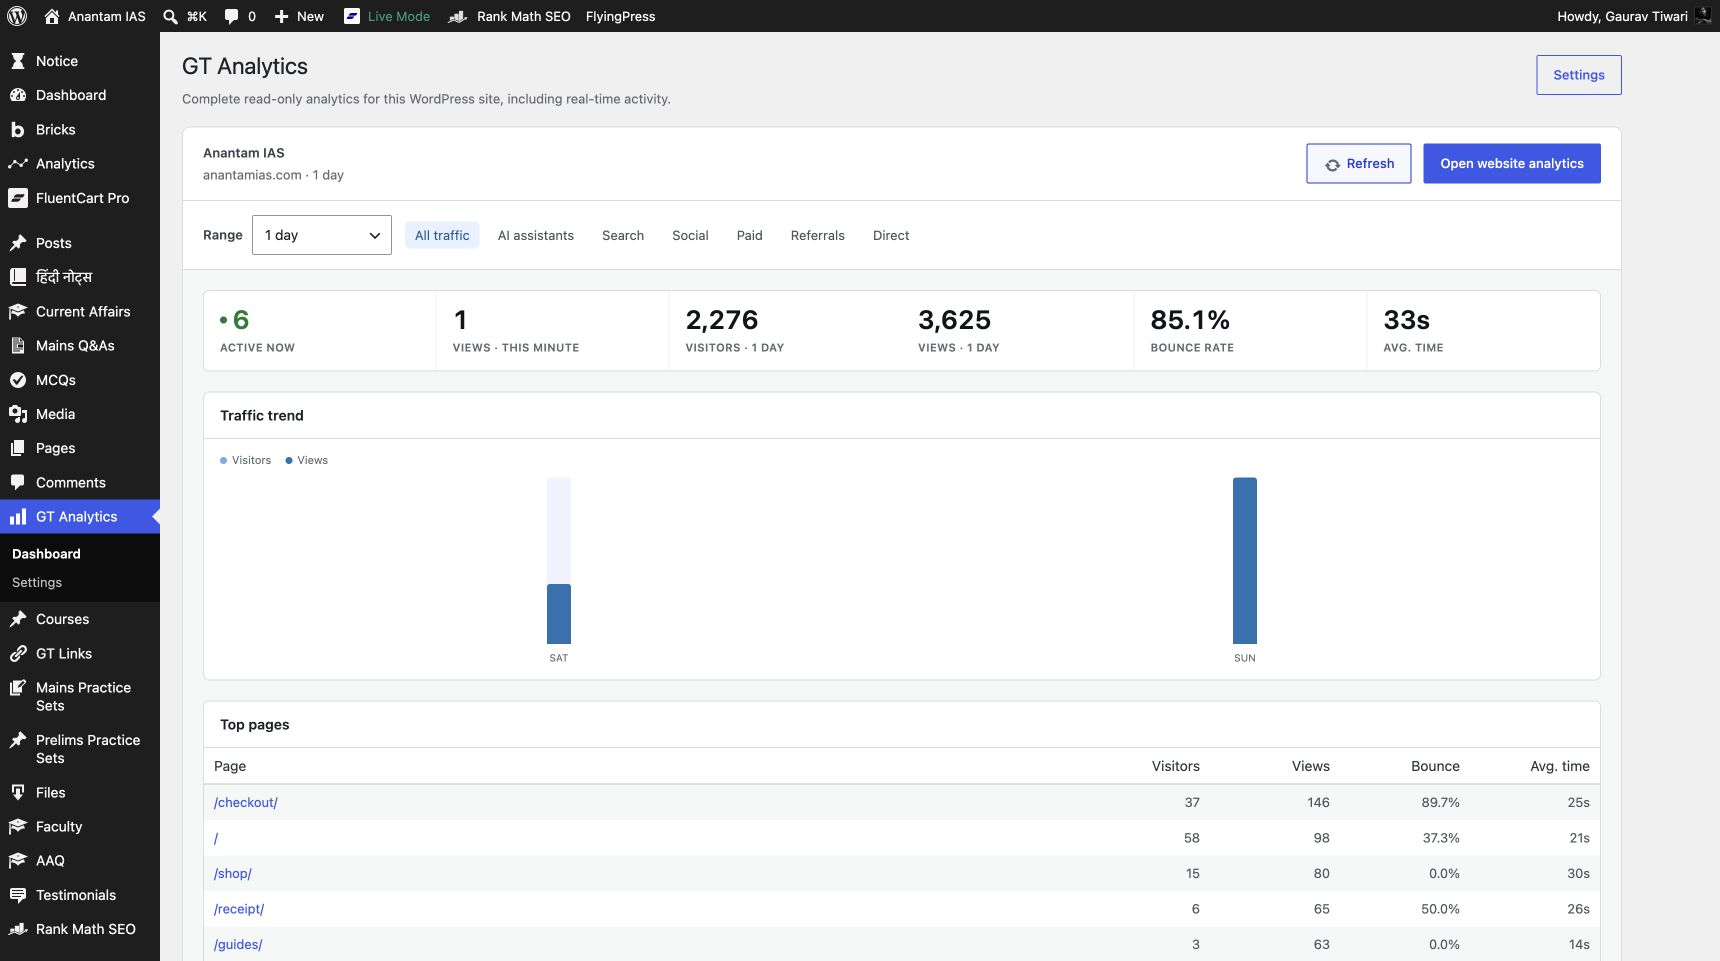
I call it GT Analytics. It has only been running in this form for two days, so I won’t pretend a short window proves perfection. What I can show is the mechanism, the live data from Anantam IAS, and the specific tracking mistakes the fork now avoids. That is a more useful meaning of accurate than a loud percentage with no method behind it.
Why I built another analytics tool
GT Analytics exists because every alternative I tried solved part of my problem and then introduced another compromise. My sites aren’t all hobbies, my traffic isn’t priced in US dollars, and I don’t want to open a separate WordPress dashboard for every property just to understand what is happening across the network.
I had already compared the broader market in my guide to Google Analytics alternatives for WordPress. Four options kept coming back into the discussion:
- Fathom is clean, hosted, privacy-focused, and supports many sites. Its entry plan is $15 per month, though, and custom events count toward billable pageviews.
- Plausible is one of the best-designed hosted analytics products. Its starting price is lower, but site counts, traffic, consolidated reporting, API access, funnels, and ecommerce features move across plans.
- Jetpack Stats is familiar inside WordPress, but a commercial site needs a paid plan. The current India price shown for 10,000 views is INR 489.95 per month when billed yearly, and the analytics module arrives through the wider Jetpack plugin.
- Independent Analytics remains my favorite WordPress-native analytics plugin. Its free version has unlimited pageviews, and I own the Agency license. The problem is structural: each site reports inside its own WordPress dashboard. An unlimited-site license isn’t the same as one cross-site dashboard.
The country part matters. Fifteen or twenty US dollars each month may look small in a SaaS pricing table. Convert that to Indian rupees, multiply it across years, then add plan limits as traffic grows. The supposedly simple analytics bill becomes another permanent tax on publishing.
I wanted a different arrangement: own the deployment, let Cloudflare absorb the analytics workload, and impose no GT Analytics product limit on sites, pageviews, events, or conversions. Cloudflare account limits and usage charges still apply, of course. Self-hosted doesn’t mean physics and invoices disappear.
CounterScale gave me the foundation, not the finished tool
CounterScale was the right foundation because it already treated Cloudflare as the platform, not merely a CDN in front of an analytics server. It gave me a good base for collecting and querying traffic without renting and maintaining another VPS.
But three missing pieces blocked me almost immediately:
- Real-time analytics didn’t tell me who was visibly active now.
- Conversions and useful custom events weren’t first-class reports.
- Attribution and engagement tracking weren’t precise enough for the decisions I wanted to make.
That is where the fork stopped being a rename. I changed the tracker, data model, real-time layer, reports, authentication, account administration, API, WordPress integration, deployment flow, and interface. “Why not fork it and improve it?” became the working question. GT Analytics is the answer: my ideas, my WordPress work, and my love for Cloudflare working hand in hand.
Why this Cloudflare analytics tool is more accurate for me
No web analytics tool sees every human visit. A browser extension can block the request. A network call can fail. Privacy controls can remove context. Anyone promising perfect counts is selling confidence, not measurement.
GT Analytics is accurate in the way that matters to me: each number has a narrower meaning, and one kind of activity doesn’t quietly inflate another.
- A pageview is a pageview. Custom events, conversions, presence heartbeats, and engagement duration go to their own data paths.
- Known bots are filtered using Cloudflare’s verified-bot signal and the
isbotuser-agent library. - An active reader must keep the page visible. A lightweight presence heartbeat runs every 30 seconds, and the reader leaves the active count after two minutes without a visible heartbeat.
- Presence doesn’t create extra pageviews. Refreshing the live panel doesn’t manufacture traffic.
- First-touch attribution stays stable during the browser session, while internal referrals are removed from acquisition reports.
- UTM source, medium, campaign, term, and content are stored as separate fields instead of being squeezed into one referrer string.
- Advertising click identifiers are recognized by name, but their values aren’t stored.
- Engagement duration is recorded separately so a time update can’t masquerade as a visit or conversion.
This is why I trust the shape of the data. The total may still differ from another analytics product because the products use different rules. That isn’t automatically an error. The question is whether the rule matches the decision you are trying to make.
Dashboard
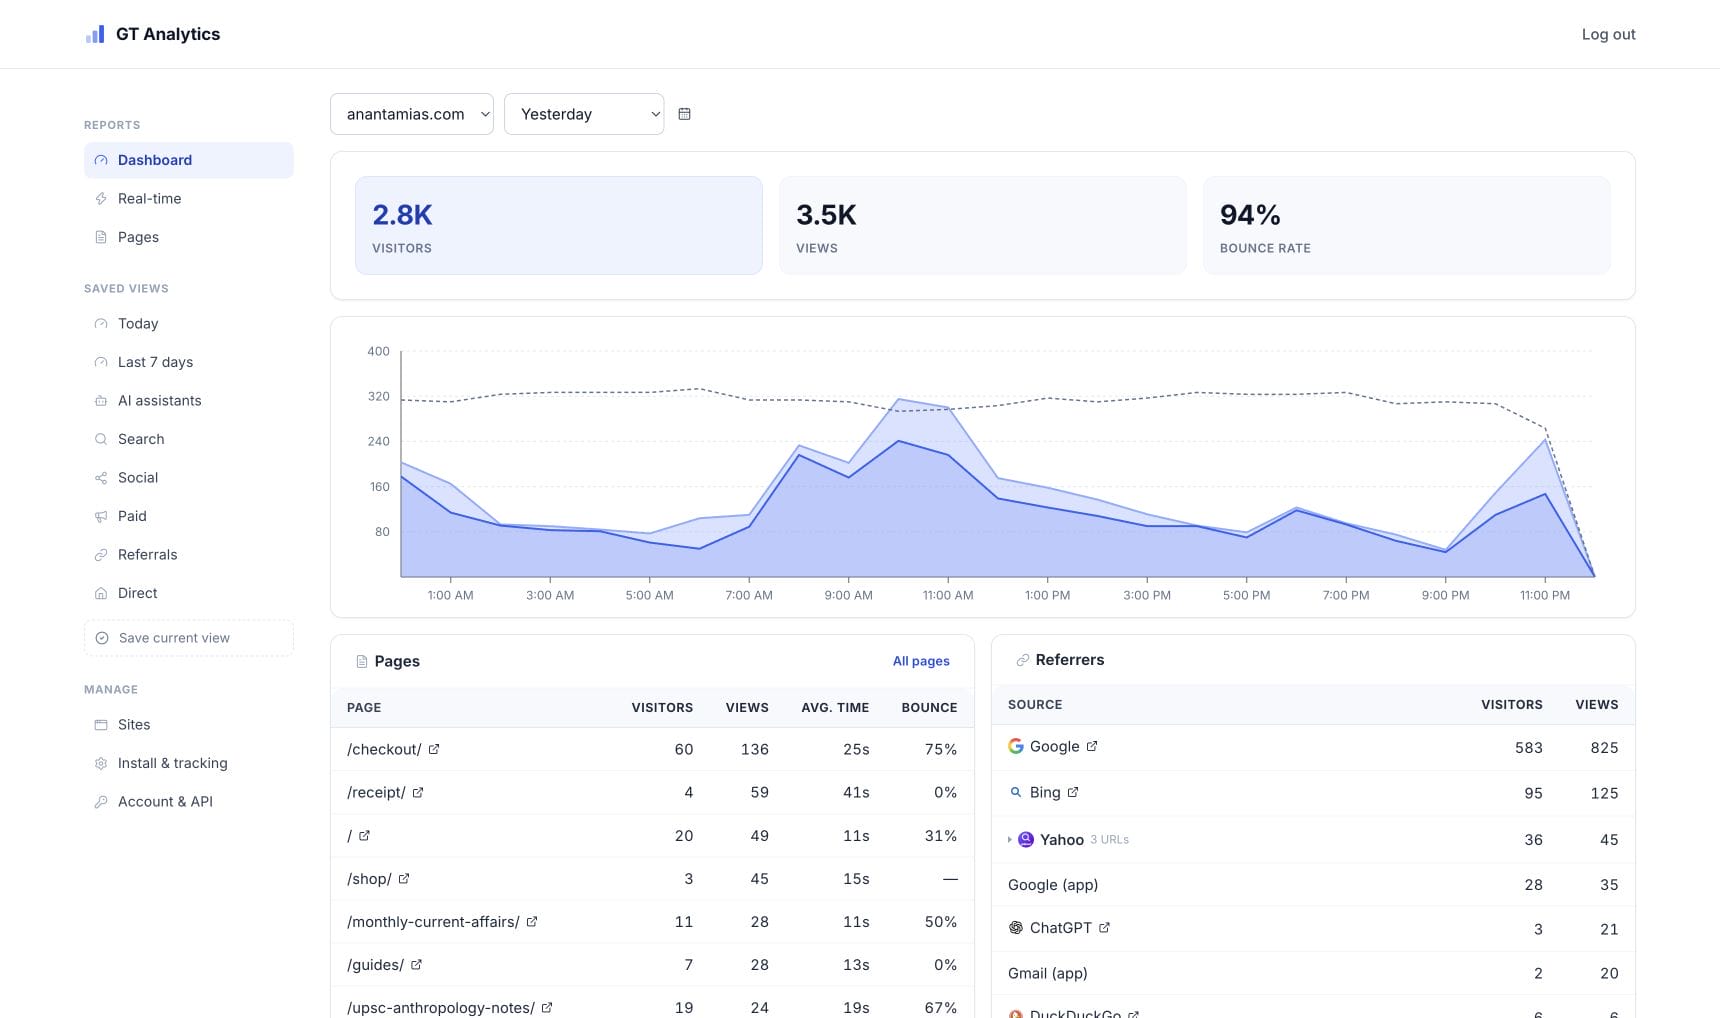
The daily dashboard answers the first questions I ask every morning: how many people came, what they read, where they arrived from, and whether the traffic was useful. I selected the previous day because the current GT Analytics deployment is only two days old. A 7-day or 30-day chart would imply history that doesn’t exist yet.
The daily view includes:
- unique visitors and total pageviews;
- bounce rate and average engagement time;
- traffic trend by time of day;
- top pages and entry paths;
- referral sources and marketing channels;
- country, browser, device, and campaign filters when deeper analysis is needed;
- a dedicated Pages report for inspecting one URL instead of reading a site-wide average.
Real-time means a visible reader, not a recent request
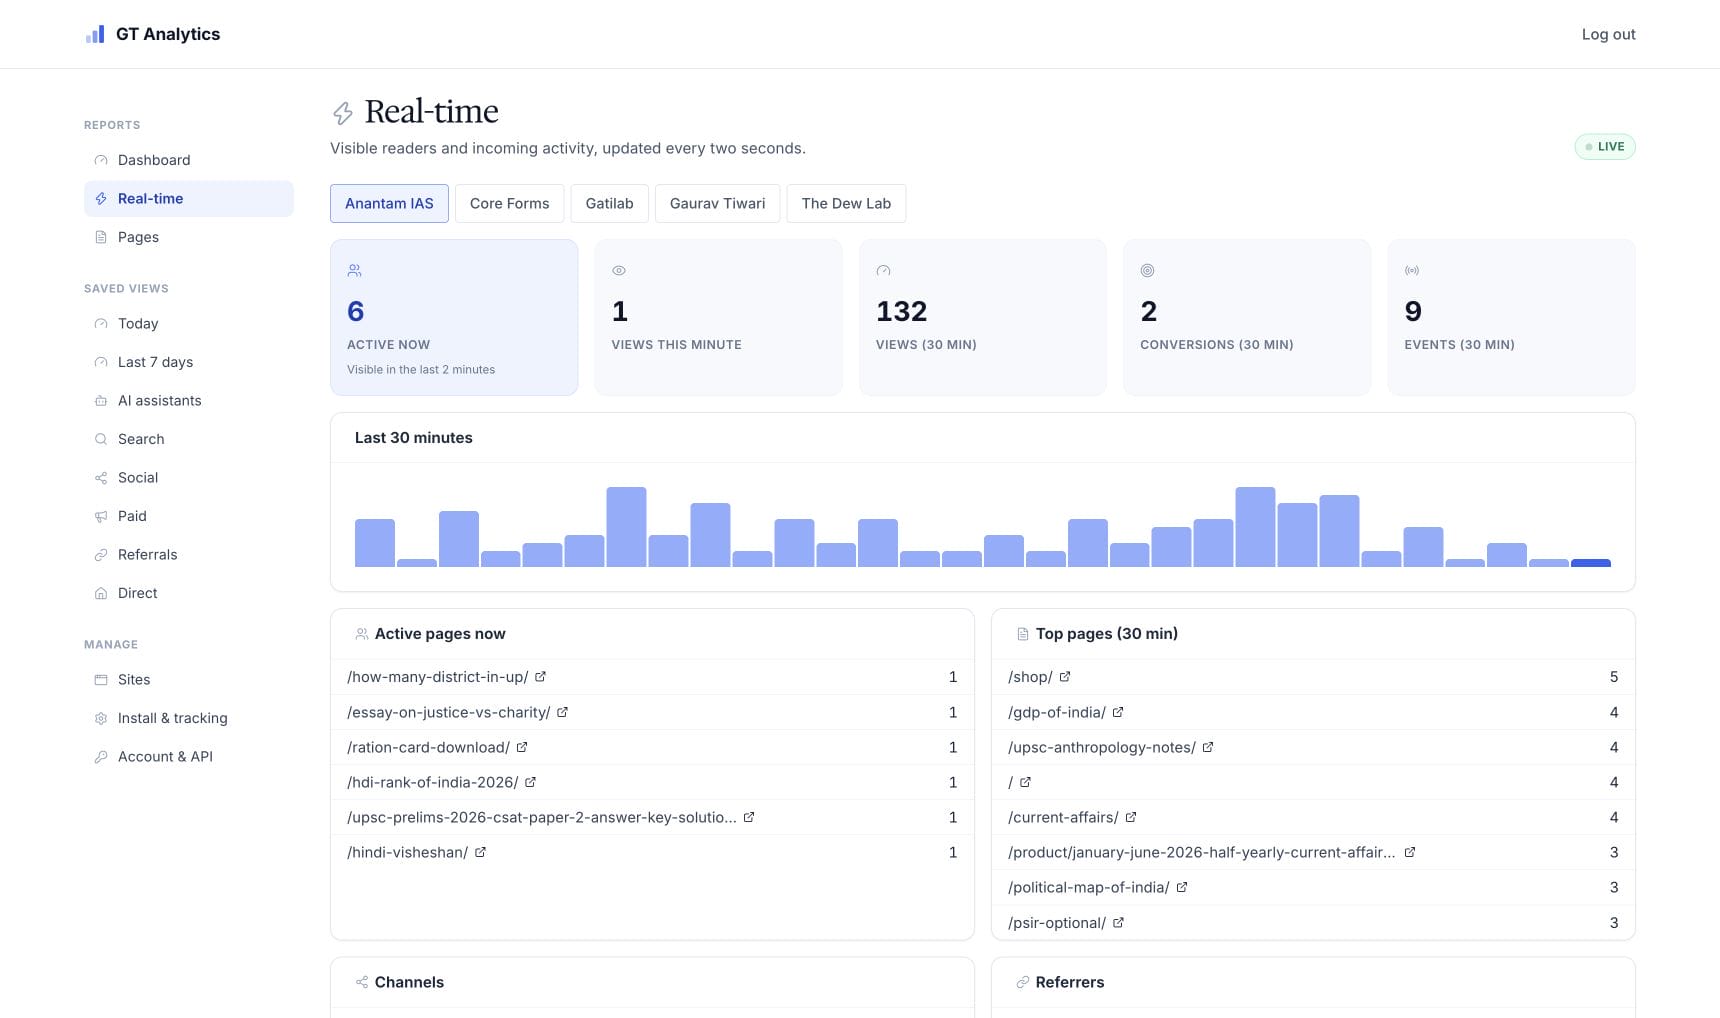
Many products call a rolling collection of recent events “real-time.” GT Analytics separates two questions: who is visibly active now, and what happened during the last 30 minutes?
The real-time screen shows:
- active visible readers now;
- views in the current minute;
- rolling 30-minute views;
- conversions and custom events in the same window;
- a minute-by-minute traffic chart;
- active pages and top pages;
- site-level real-time data or an all-sites overview.
That distinction fixed my first CounterScale blocker. A tab abandoned in the background shouldn’t look like an attentive reader forever. A conversion should be visible beside traffic while a campaign is running, not discovered the next morning.
Everything GT Analytics can do
GT Analytics has grown beyond a traffic counter. The easiest way to understand the feature set is to group it by the decision each part supports.
Traffic and content reporting
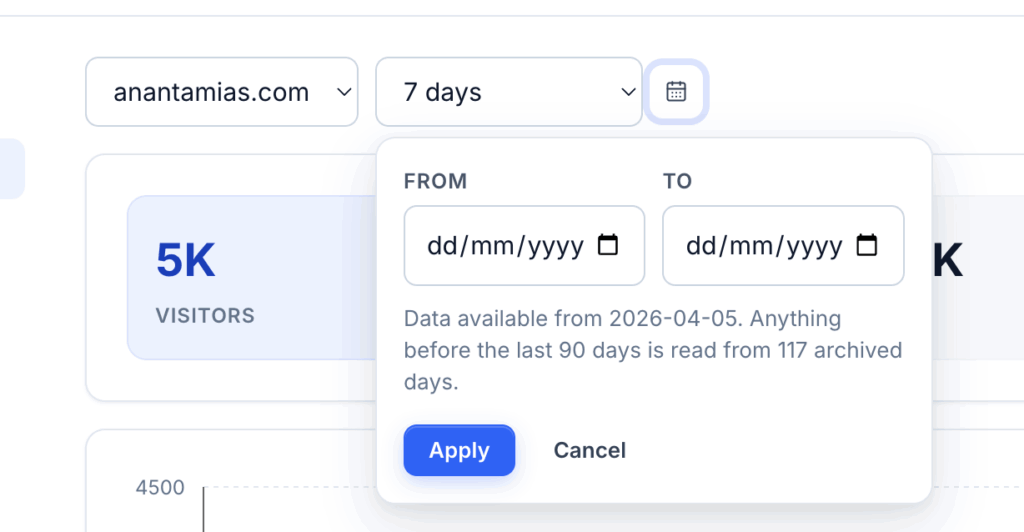
The main reports cover visitors, views, bounce rate, engagement time, traffic trends, top pages, entry paths, referrers, countries, browsers, devices, and channels. Date ranges include today, yesterday, 1, 7, 30, 90, 180, and 365 days, plus custom ranges when the archive contains the data.
You can filter analytics by path, channel, country, browser, device, UTM fields, and other acquisition dimensions. Saved views turn repeated filter combinations into reusable reports. The selected site is remembered, which sounds minor until you manage several properties every day.
Campaign and attribution tracking
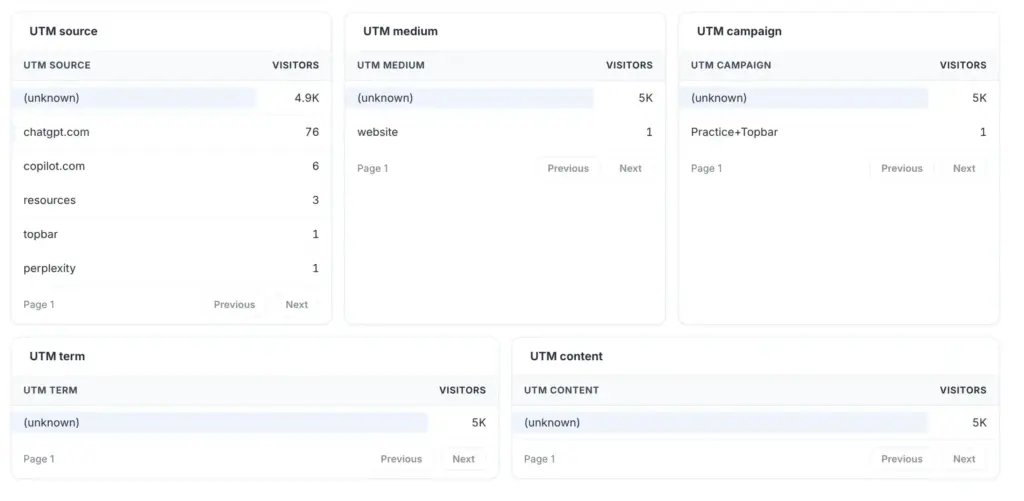
GT Analytics stores UTM source, medium, campaign, term, and content separately. It recognizes common paid-click identifiers without saving their values, keeps first-touch attribution for the session, excludes internal referrals, and provides channel reporting that doesn’t depend on a single messy referrer field.
Events, conversions, and revenue signals
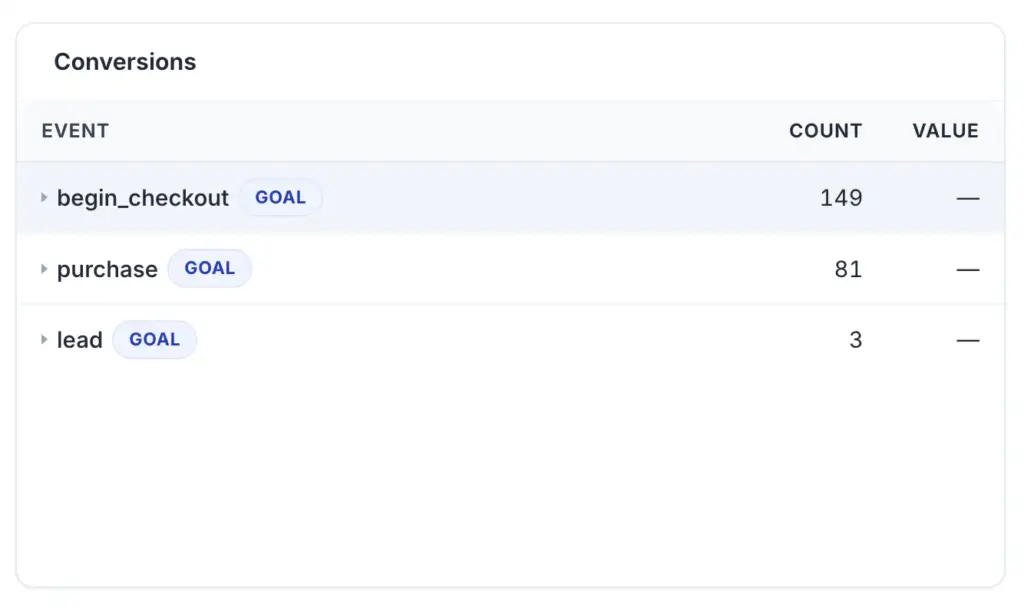
Custom events and conversions are separate from pageviews. The tracker can capture outbound link clicks, downloads, affiliate clicks, lead submissions, and ecommerce steps such as add to cart, checkout, and purchase. I also added recipes for Fluent Cart and Core Forms because generic event documentation isn’t enough when the actual work happens inside WordPress.
There is no GT Analytics plan gate on the number of events or conversions. The practical ceiling is the capacity and quota of the Cloudflare account where you deploy it.
Multi-site accounts and administration
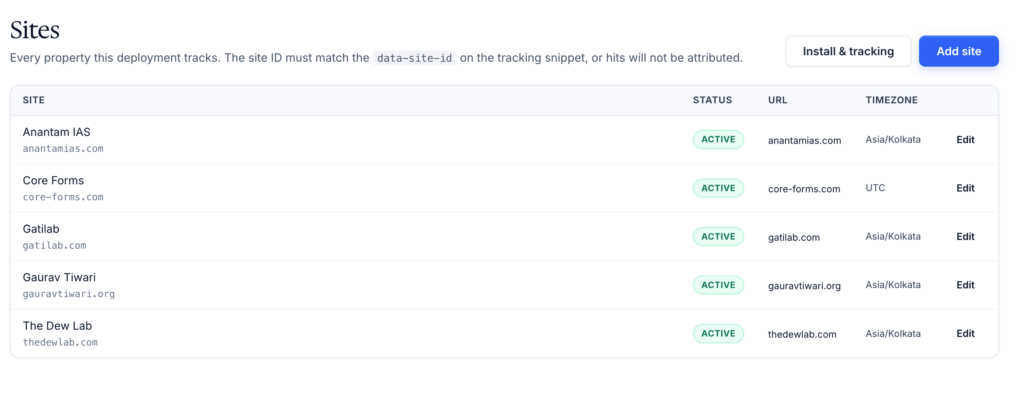
One GT Analytics account can manage multiple sites from one dashboard. The administration layer includes accounts, sites, invitations, account roles, password login, discoverable passkeys, revocable sessions, site-scoped API keys, saved views, and an all-sites real-time view.
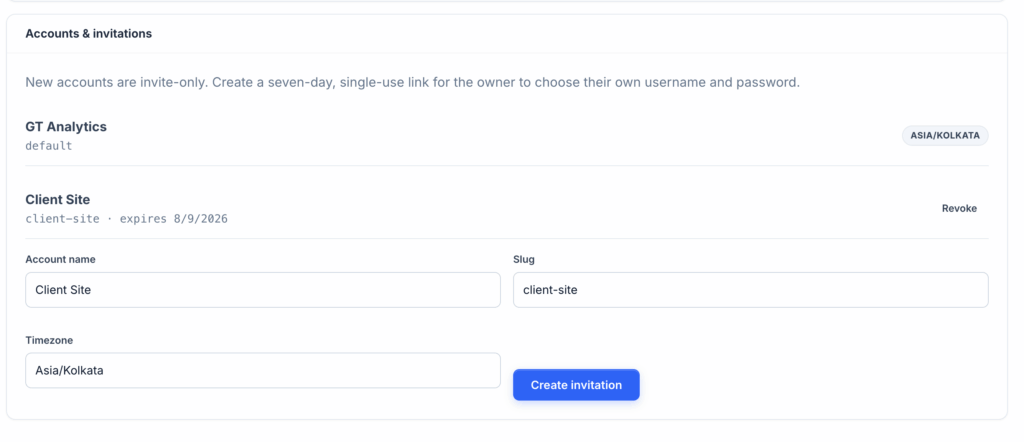
Invitations are single-use and expire. API keys are hashed and can be revoked. A key can be restricted to one site, which is exactly what the WordPress plugin needs. Giving a WordPress site access to every property in the account would be easier to code and much harder to defend.
Privacy and data ownership
The tracker is cookieless and doesn’t create a cross-session identity. It records enough context to explain traffic without trying to build an advertising profile. You deploy the system in your Cloudflare account, so the application and analytics data stay under your control.
This isn’t a legal promise that every configuration automatically satisfies every privacy law. It is a smaller data surface and a much better starting position than collecting identifiers you don’t need.
API, WordPress, and exports
The read API exposes sites, filtered analytics, and real-time data, with an OpenAPI description for integrations. Site-scoped keys let another application read one property’s reports without receiving account-wide access.
The WordPress dashboard is the first client I built on that API. Long-term data is archived to R2 in Apache Arrow files, then merged with recent Analytics Engine results when a report crosses the archive boundary. This keeps historical reporting available beyond the 90-day Analytics Engine window.
Read: How I Serve WordPress Assets from Cloudflare R2 (For Almost Free.)
Deployment and maintenance
GT Analytics includes a one-command installer, D1 migrations, Cloudflare binding setup, secret prompts, dashboard authentication, Worker deployment, and a GitHub Actions release path. The repository also includes the browser tracker, server tracker, CLI, WordPress plugin, integration examples, tests, and deployment checks.
Install the tracker and set up conversions
Every site gets a unique site ID in GT Analytics. The usual choice is the site’s hostname because it is easy to recognize, but the value only needs to match the site record exactly. Copy the installation snippet from that site’s settings and paste it once inside the site’s <head>.
Add the tracking script
<script
    id="counterscale-script"
    src="https://YOUR-GT-ANALYTICS-DOMAIN/tracker.js"
    data-site-id="example.com"
    defer
></script>
Keep defer and keep the tag in the head. That lets the browser record the first pageview without blocking page rendering, and it avoids some WordPress optimization tools delaying or rewriting a footer script. The tracker also follows pushState and popstate, so single-page navigation can be counted without installing a second integration.
For WordPress, add the snippet through the theme’s documented head hook, a small site plugin, or a trusted code-snippet manager. Don’t paste it into a page block that appears on only one URL. Clear the site cache after saving, visit a normal page in a private window, then confirm the pageview in GT Analytics real-time reporting.
Send events and conversions
GT Analytics exposes one small browser command: gta(). Use event for useful behavior and conversion for an outcome that counts toward a goal.
<script>
gta('event', 'download', { label: 'course-brochure.pdf' });
gta('conversion', 'lead', { label: 'consultation-form' });
gta('conversion', 'purchase', {
    value: 16999,
    currency: 'INR',
    label: 'gs-foundation'
});
</script>
The options are deliberately small:
labeladds one useful dimension such as a form ID, product, plan, or file name.valueaccepts a finite number such as an order total.currencyaccepts a currency code such asINRand should be sent withvalue.
The command uses sendBeacon when the browser supports it, with an image-request fallback. That matters because conversions often happen immediately before a form redirect, checkout navigation, or outbound click.
Make early calls safe
The tracker tag uses defer. If a conversion can fire before tracker.js initializes, add this small queue before the tracker tag:
<script>
window.gta = window.gta || function () {
    (window.gta.q = window.gta.q || []).push(arguments);
};
</script>
GT Analytics drains the queue when the tracker loads. A typo or failed analytics call is ignored rather than being allowed to break the page.
Track a success, not an attempt
The most common conversion mistake is firing on a button click. A click doesn’t prove the form passed validation, the cart changed, or the payment completed. Attach the command to the system’s success signal.
For Core Forms, the integration listens for cf-success, which fires after a successful AJAX submission:
document.addEventListener('cf-success', function (event) {
    var form = event.target.closest('.cf-form') || event.target;
    var formId = form.getAttribute('data-id') || 'unknown';
    gta('conversion', 'lead', { label: formId });
}, true);
For Fluent Cart, the included recipe waits for fluentCartNotifyCartDrawerItemChanged before recording add_to_cart, uses fluentCartModalCheckoutOpened for modal checkout, recognizes direct checkout URLs, and records a purchase only from a receipt URL carrying an order token. The token is used locally for deduplication and is never copied into analytics.
For exact revenue, use the included Fluent Cart PHP receipt hook. It reads the paid order total and currency from the order object, fires the purchase conversion only after the receipt is confirmed, and avoids parsing formatted money from the page. If you enable that server-backed receipt snippet, remove the JavaScript purchase hook or every order will be counted twice.
Use a conversion map before writing code
Name the outcomes first. A small site may need only this map:
| Action | Type | Name | Label or value |
|---|---|---|---|
| PDF or ZIP click | Event | download | File name |
| External link click | Event | outbound_click | Destination hostname |
| Affiliate redirect | Conversion | affiliate_click | /go/ slug |
| Successful form | Conversion | lead | Form ID or purpose |
| Confirmed cart update | Event | add_to_cart | Product ID |
| Checkout opened | Conversion | begin_checkout | Product or checkout type |
| Paid receipt | Conversion | purchase | Numeric value and currency |
Use stable lowercase names, never put an email address, receipt token, or other personal data in label, and deduplicate conversions that can be revisited. Then test one action at a time in the real-time feed. You should see the event or conversion appear without the pageview count increasing.
WordPress gets the report, not the analytics workload
The Anantam IAS WordPress dashboard is a deliberate part of the architecture. WordPress displays the analytics, but it doesn’t collect, store, aggregate, or query the raw traffic on the site’s own database server.
Instead, the plugin makes an authenticated server-side request to the GT Analytics API. The browser never receives the site API key. WordPress returns the report through nonce-protected requests, and the plugin can show both a full Analytics screen and a compact Dashboard Home widget.
That separation matters on busy WordPress sites:
- the visitor-facing tracker sends data to Cloudflare, not
admin-ajax.php; - the site’s MySQL database doesn’t become an analytics warehouse;
- report queries run against Cloudflare’s analytics data and archive;
- one site-scoped API key can be revoked without affecting other properties;
- the same dashboard works without exposing account-wide administration to WordPress.
I still like Independent Analytics, and my Independent Analytics review explains why. GT Analytics solves the part it can’t solve for me: a single operational view across properties, with the report optionally available inside each WordPress site.
GT Analytics vs Fathom, Plausible, Jetpack Stats, and Independent Analytics
GT Analytics isn’t automatically better for everyone. It is better when you want ownership, multiple sites in one dashboard, Cloudflare-native operations, WordPress API reporting, and no vendor plan gate on traffic or events. A hosted product is better when you want someone else to operate the system and support it.
The prices below are the entry points shown when I checked the official product pages. Plans and exchange rates change, so treat them as comparison anchors rather than permanent promises.
| Decision | GT Analytics | Fathom | Plausible | Jetpack Stats | Independent Analytics |
|---|---|---|---|---|---|
| Hosting | Your Cloudflare account | Vendor-hosted | Vendor-hosted or community self-hosted | Your WordPress site plus Jetpack services | Your WordPress site |
| Entry price | No GT subscription; Cloudflare usage may cost money | $15/month for up to 100K pageviews | $9/month at 10K monthly pageviews | Free for eligible personal sites; commercial plan shown at INR 489.95/month billed yearly for 10K views | Free; Pro starts at $49/year for one site |
| Multiple sites | One dashboard, subject to your Cloudflare capacity | 50 sites on the entry plan | 1 site on Starter, 3 on Growth, 10 on Business at the 10K tier | Per connected WordPress site | Licenses cover multiple sites, but reports live inside each site’s dashboard |
| Consolidated reporting | Built in | Yes | Business plan | No cross-site GT-style console | Not advertised as one cross-site dashboard |
| Real-time | Visible readers now plus rolling 30 minutes | Yes | Yes, refreshes about every 30 seconds | Yes | Pro only |
| Events and conversions | Separate datasets and reports; no GT product cap | Included, but custom events count as pageviews | Goals and custom events; advanced conversion features vary by plan | Tracks selected interactions; commercial limits apply | Pro adds clicks, forms, ecommerce, and campaigns |
| WordPress impact | Tracking and aggregation run on Cloudflare; plugin reads the API | Lightweight script | Lightweight script | Requires Jetpack on WordPress | Collection and reports run in WordPress |
| Long-term data | R2 Arrow archive plus recent Analytics Engine data | Retained while subscribed | 3 to 5 years on listed plans | Depends on plan and service | Stored in your WordPress database |
| API | Site-scoped read API with OpenAPI | API, 600 requests/hour | Stats API on Business, 600 requests/hour | Jetpack ecosystem APIs | WordPress-local data and integrations |
| Best fit | Builders who want control and can own deployment | Teams wanting a polished hosted service across many sites | Teams wanting a polished hosted product with funnels and journeys | Existing Jetpack users who want reports inside WordPress | One-site-at-a-time WordPress reporting with no pageview cap |
Fathom deserves credit for including 50 sites on its starting plan. Plausible deserves credit for a polished product and mature funnel reporting. Independent Analytics deserves credit for unlimited pageviews, useful page-level reporting, and a generous free version. Jetpack Stats is convenient if Jetpack is already central to your site.
My disagreement is with the bundle of compromises, not the competence of the products. GT Analytics lets me choose Cloudflare’s bill, limits, and operational model instead of a vendor’s analytics plan matrix.
The Cloudflare architecture behind GT Analytics
There is no traditional analytics server to maintain. The system is split across Cloudflare services so each part does one job well. If you already use the platform for a full Cloudflare WordPress setup, the pieces will feel familiar.
- Cloudflare Workers serve the dashboard, collector, API, and scheduled jobs at the edge.
- Analytics Engine stores recent pageviews, events, conversions, engagement, and queryable dimensions.
- Durable Objects maintain real-time counters and visible-reader presence with consistent state.
- D1 stores accounts, sites, invites, saved views, passkeys, sessions, and site-scoped API key records.
- R2 stores compact Apache Arrow archives for long-term history.
- Scheduled Workers move completed daily data into the archive and keep recent and historical reporting joined.
The application is written in TypeScript with React Router. Recharts handles the charts, Lucide supplies the icons, and Vite handles the build. The dashboard follows the Core Forms Design System: Inter for interface text, Hedvig Letters Serif for editorial contrast, restrained borders, dense but readable tables, and one clear accent color.
I didn’t use Tailwind or shadcn. Both are useful, but the goal was to keep the visual language consistent with the WordPress tools I already build, not make another interchangeable SaaS dashboard.
How to deploy GT Analytics in your own Cloudflare account
You don’t need to deploy GT Analytics on a VPS. You deploy it into your own Cloudflare account. The installer provisions the required services, applies the database migrations, asks for secrets, builds the application, and deploys the Worker.
You need:
- a macOS or Linux machine;
- Git and Node.js 20 or newer;
- a Cloudflare account with Workers and Analytics Engine available;
- a Cloudflare Account Analytics Read API token;
- permission to create D1, R2, Durable Object, and Worker resources;
- a few minutes to complete Cloudflare authentication and the guided prompts.
Run the installer from a terminal:
curl -fsSL https://raw.githubusercontent.com/wpgaurav/gt-analytics/main/install-cloudflare.sh | bash
The installer creates a local .gt-analytics/wrangler.json for your deployment, provisions the Cloudflare bindings, runs D1 migrations, configures authentication, and deploys to a workers.dev address. You can attach a custom domain afterward.
The GT Analytics repository contains the README, deployment details, tracker examples, API notes, WordPress plugin, and source. Read the requirements before running a remote shell installer, and review the script first if that is part of your security practice.
I can install it for $30
If you want GT Analytics but don’t want to spend an afternoon on Cloudflare bindings, migrations, secrets, and WordPress connection, I will do the initial setup in your Cloudflare account for a flat $30.
The offer is intentionally narrow:
- one-time GT Analytics deployment;
- connection of the first site and, when requested, its WordPress dashboard;
- your Cloudflare account and your data remain yours;
- no ongoing warranty, monitoring, updates, or future fixes are included;
- maintenance is separate and paid only when you need it.
You can ask me about the $30 GT Analytics setup or use my broader analytics and tracking service when the project needs strategy, conversion planning, or custom integrations too.
Who should use GT Analytics, and who should skip it
GT Analytics is for a particular kind of owner. You care about the data, want one view across sites, and would rather own a Cloudflare deployment than rent another SaaS dashboard forever.
It is a good fit when you:
- manage several websites or client properties;
- already use Cloudflare and understand its account model;
- need live traffic, custom events, and conversion reporting together;
- want WordPress reports without turning WordPress into the analytics server;
- value site-scoped APIs and self-owned data;
- are comfortable maintaining a small application or paying someone when maintenance is required.
Skip it if you want a vendor to own support, incident response, upgrades, and billing predictability. Fathom or Plausible will cost more over time, but that recurring fee buys operational responsibility. GT Analytics gives you control, which also means the responsibility is yours.
That is the trade I wanted. Two days in, the data is already more useful because the definitions match how I make decisions. The next test is not a launch-day screenshot. It is whether the same system remains understandable after months of campaigns, conversions, archive merges, and WordPress use. That is the standard I am building toward.
Frequently Asked Questions
What is GT Analytics?
GT Analytics is a self-hosted Cloudflare analytics tool for multi-site traffic, real-time presence, events, conversions, attribution, and WordPress reporting. It is a hard fork of CounterScale with a new tracker, real-time layer, administration system, archive, API, deployment flow, and interface.
Is GT Analytics free?
GT Analytics doesn’t charge a software subscription or impose its own pageview, event, or conversion plan. You are still responsible for Cloudflare usage, account quotas, domain costs, and any setup or maintenance help you purchase.
Is this Cloudflare analytics tool perfectly accurate?
No analytics tool is perfectly accurate. GT Analytics can still miss blocked or failed requests. Its advantage is clearer measurement: pageviews, events, conversions, presence, and engagement are separated; known bots are filtered; and active-reader counts require a visible browser tab.
Does GT Analytics use cookies?
The default GT Analytics tracker is cookieless and doesn’t create a cross-session visitor identity. First-touch attribution is retained for the current browser session, and click identifier values aren’t stored.
Does the WordPress plugin slow down the website?
The visitor-facing analytics request goes to Cloudflare, not the WordPress database. The plugin reads reports from the site-scoped API on the server side. Any plugin adds some administration code, but WordPress isn’t asked to collect or aggregate the analytics events.
Can GT Analytics track conversions and ecommerce?
Yes. GT Analytics supports custom events, conversions, outbound clicks, downloads, affiliate clicks, lead submissions, and ecommerce steps such as add to cart, checkout, and purchase. Fluent Cart and Core Forms integration examples are included.
How long does GT Analytics keep data?
Recent data is queried from Cloudflare Analytics Engine. Completed daily data can be archived to R2 as Apache Arrow files and merged into longer reports, which extends history beyond Analytics Engine’s 90-day window.
Can you install GT Analytics for me?
Yes. The $30 one-time offer covers the initial deployment in your Cloudflare account and basic connection. It doesn’t include an ongoing warranty, monitoring, future updates, or maintenance. Those services are separate when needed.
Tell Google you want more of this.
Add Gaurav Tiwari as a preferred sourceOne tap, and this site shows up more often in your own Top Stories, AI Overviews and AI Mode. Remove it any time.
Disclaimer: This site is reader-supported. If you buy through some links, I may earn a small commission at no extra cost to you. I only recommend tools I trust and would use myself. Your support helps keep gauravtiwari.org free and focused on real-world advice. Thanks. - Gaurav Tiwari