
 by
by
High Total Blocking Time in WordPress means long browser tasks are keeping the page busy during a load test. When that work overlaps a visitor’s click or tap, your menu, search or form can feel unresponsive even though the page looks ready.
You can reduce that blocking by finding the expensive tasks, removing scripts your page doesn’t need and changing when the remaining scripts run. I would test the affected interactions after each change and track real-user Interaction to Next Paint, or INP, alongside TBT.
GT Performance is the free, GPL WordPress plugin I built for caching and frontend optimization. Its JavaScript controls let you minify, defer or delay eligible scripts, with exclusions for features that need their original loading behavior.
What Total Blocking Time Measures
Total Blocking Time measures the blocking portions of long main-thread tasks during a measured interval. The main thread handles much of the browser’s scripting, style, layout and input work. When a task holds it for too long, an interaction may have to wait.
These are the figures I use when reading a report:
- Long task: a main-thread task lasting more than 50 ms. Only the portion beyond 50 ms counts as blocking time.
- Measurement window: Lighthouse navigation tests normally measure TBT from First Contentful Paint to Time to Interactive. Other recording modes can use a different interval.
- Mobile thresholds: Lighthouse shows 0 to 200 ms in green, 200 to 600 ms in orange and over 600 ms in red. Desktop uses different thresholds.
- Score weight: TBT contributes 30% of the Lighthouse performance score; LCP and CLS contribute 25% each under the documented scoring model.
- Real-user responsiveness: INP is a separate Core Web Vital. At the 75th percentile, 200 ms or less is good and over 500 ms is poor. TBT can reveal a risk, but it does not replace INP.
For tasks wholly inside the measurement window, a 320 ms task contributes 270 ms of blocking time. Three 60 ms tasks contribute 30 ms in total. Ten 45 ms tasks contribute zero, although they still occupy the thread for 450 ms. I would look at the duration and timing of individual tasks as well as the total work.
TBT helps me investigate load-time blocking. INP measures how quickly a page responds to actual interactions, including those later in the visit. A green TBT result can miss an expensive menu, filter or checkout interaction, so I would test those actions separately.
Where the Blocking Comes From on a WordPress Site
I would look for the source of the work before changing optimization settings. On a WordPress page, that can include:
- Theme and builder features: widgets, carousels, navigation and animations. The scripts loaded depend on the page, version and asset-loading settings.
- Plugin assets: form, sharing, chat or related-content scripts loaded on pages that may not use them.
- Third-party code: tag-manager containers and the tags they trigger, advertising, session recording and embedded players.
- WordPress dependencies and optional features: jQuery, jQuery Migrate, emoji or embed assets when the theme, plugins and WordPress version enqueue them.
- Inline code: scripts embedded in the HTML, which a report may attribute to the document rather than a separate file.
- Rendering work: style calculation and layout also use the main thread. JavaScript can trigger this work, especially on a complex page.
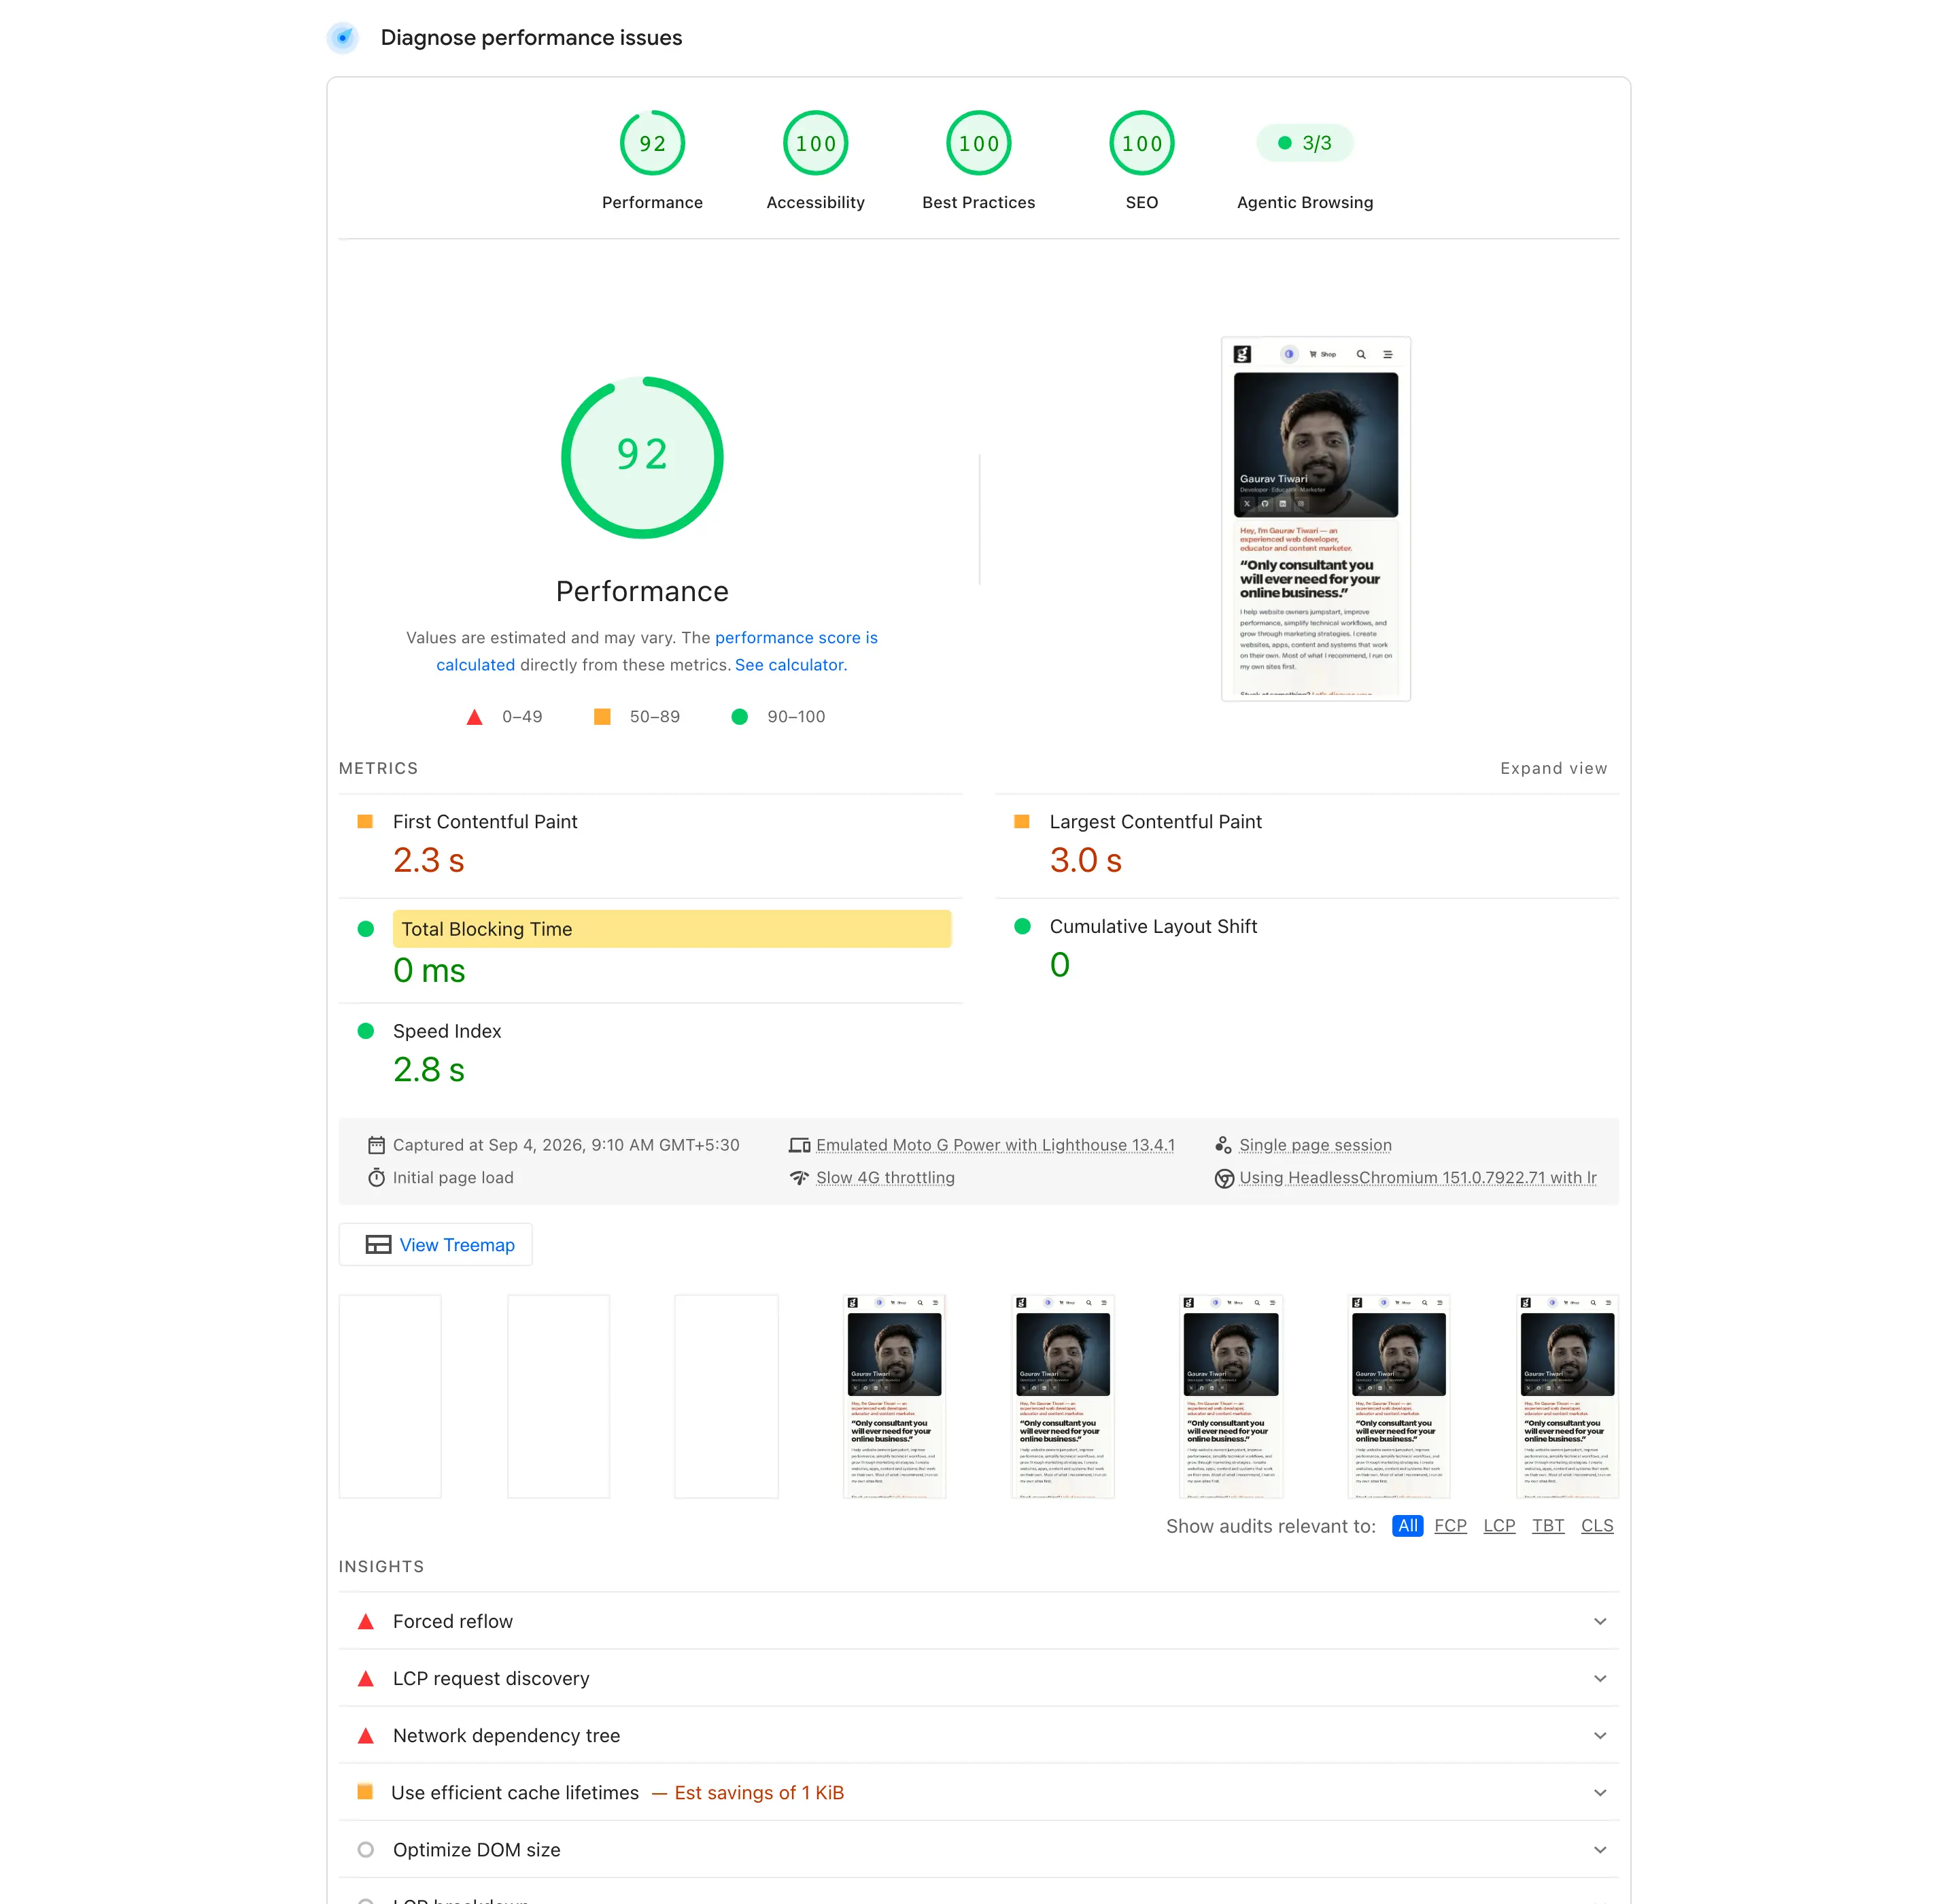
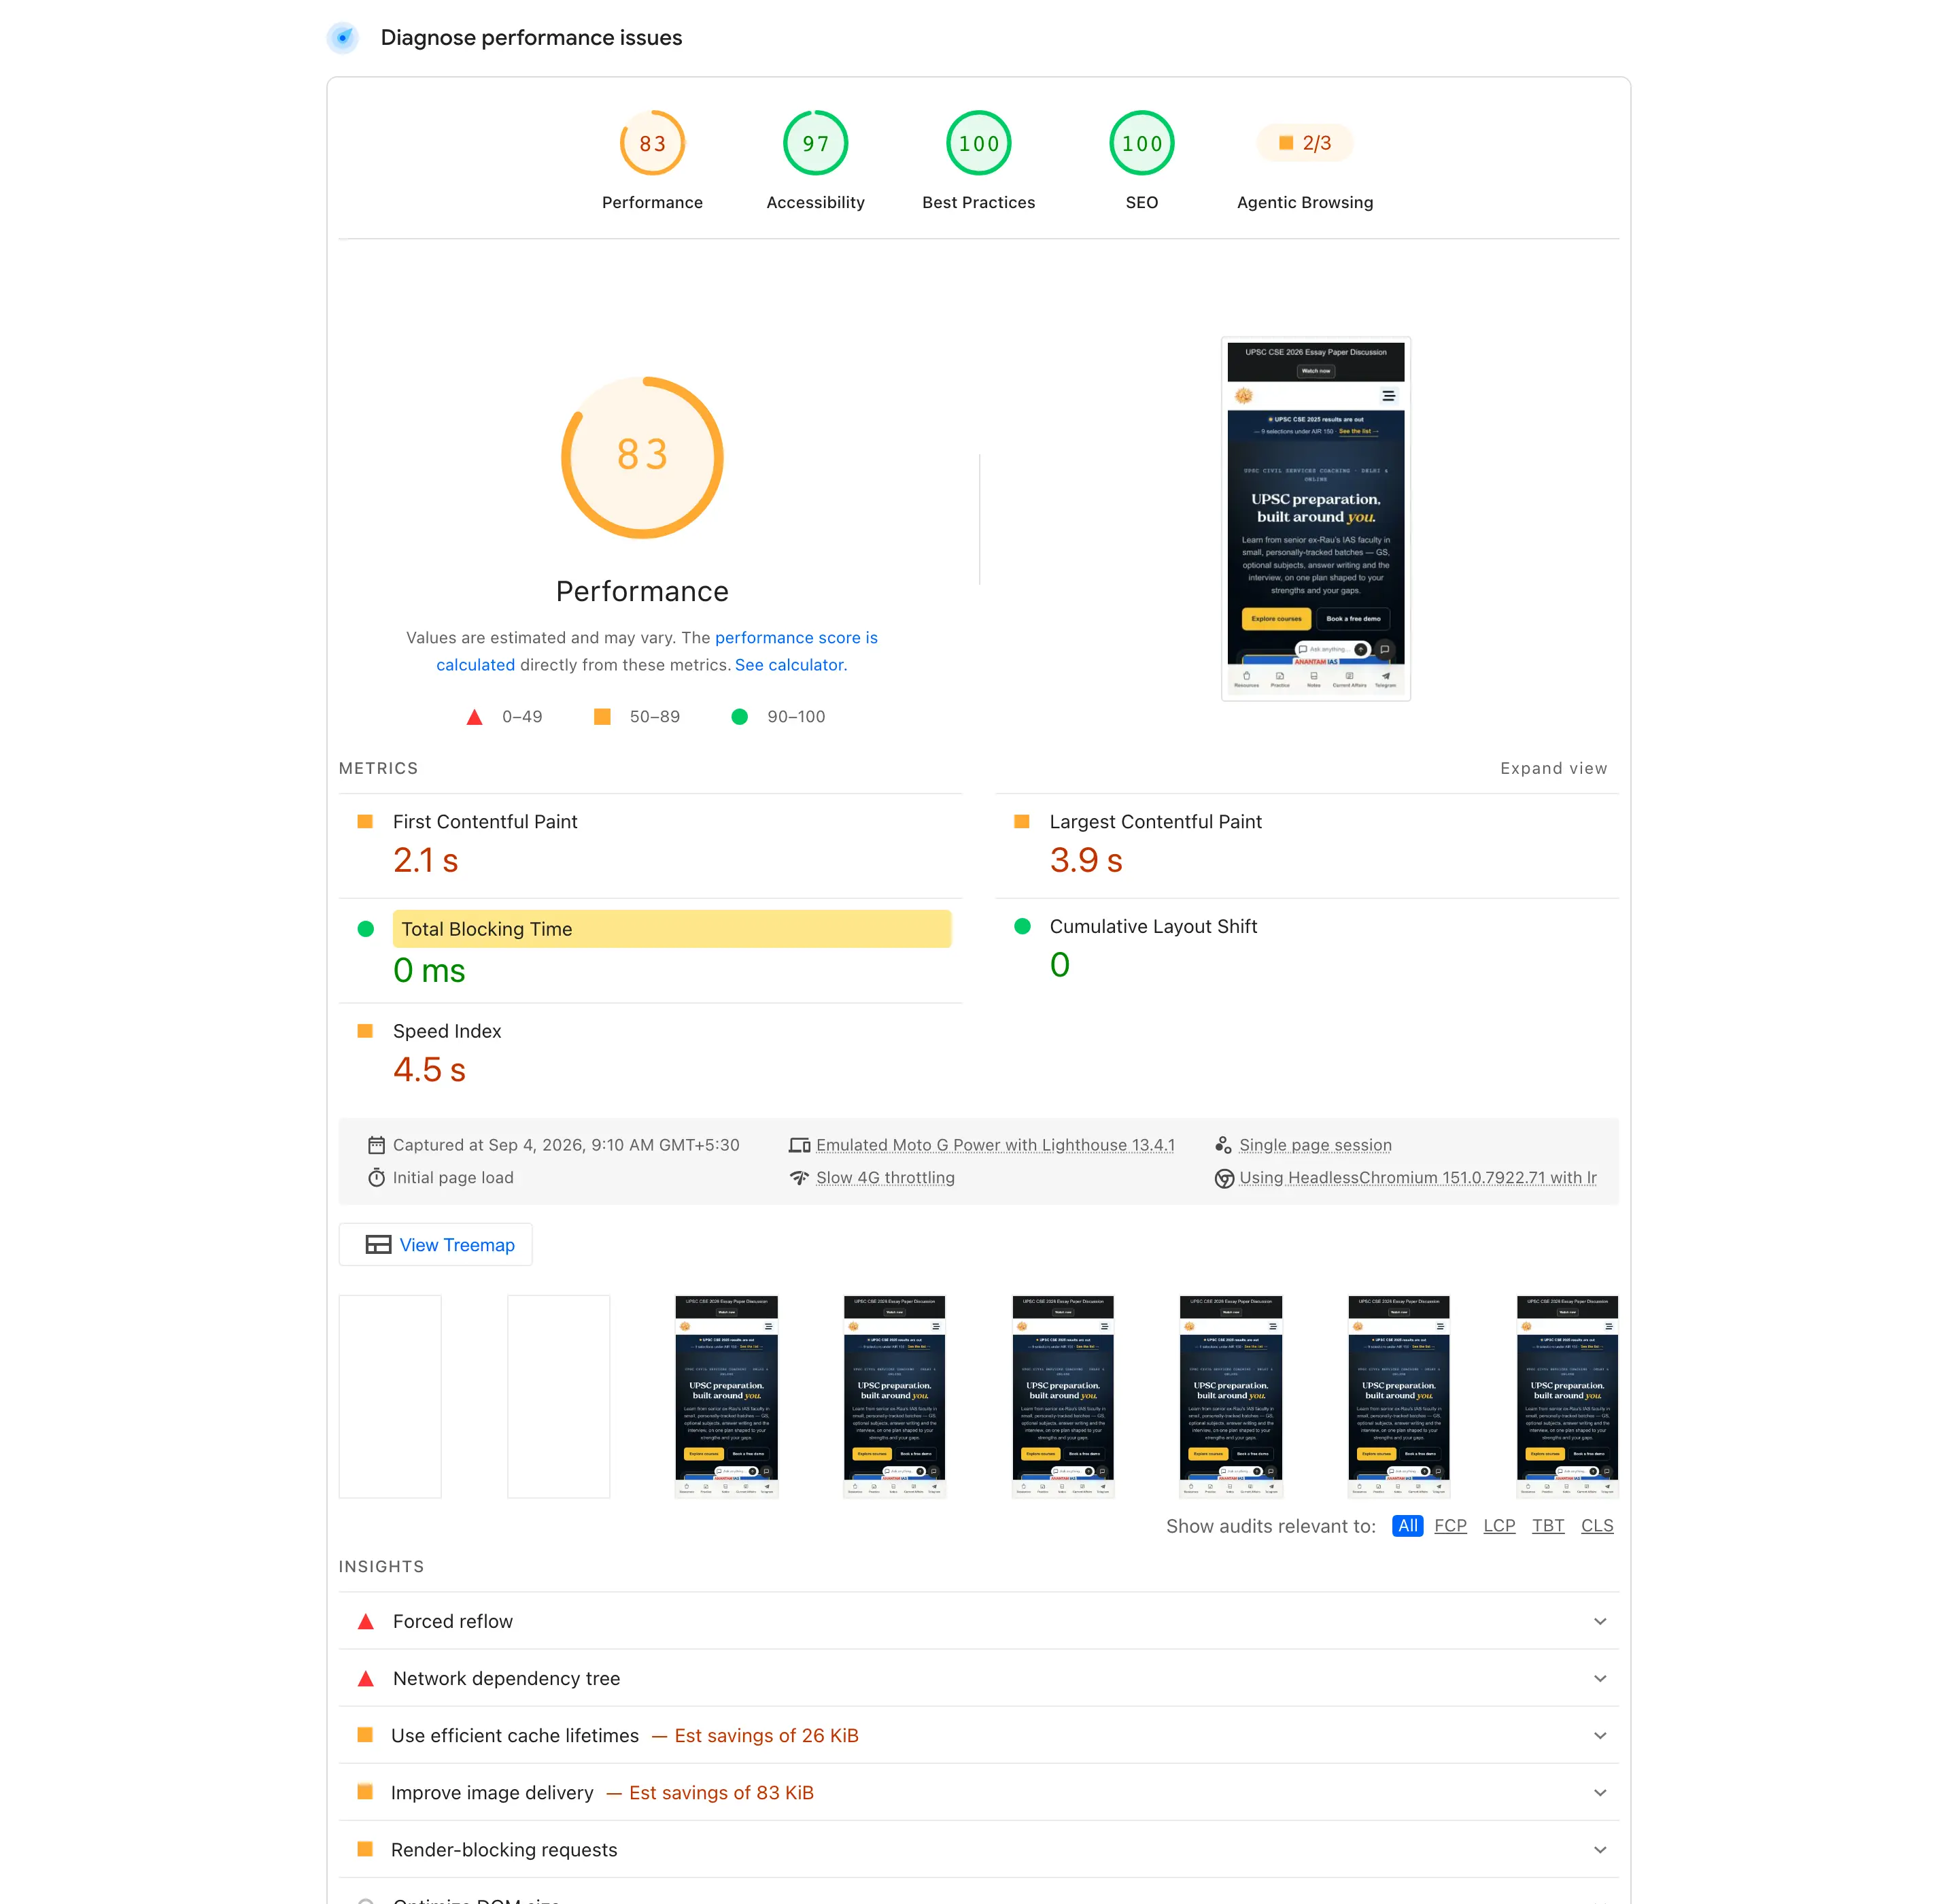
A saved mobile report for my homepage from September 4, 2026 recorded about 650 ms of style and layout work and 160 ms of script evaluation, while reporting 0 ms TBT. The totals show where the browser spent time; they do not tell us that every task was short.
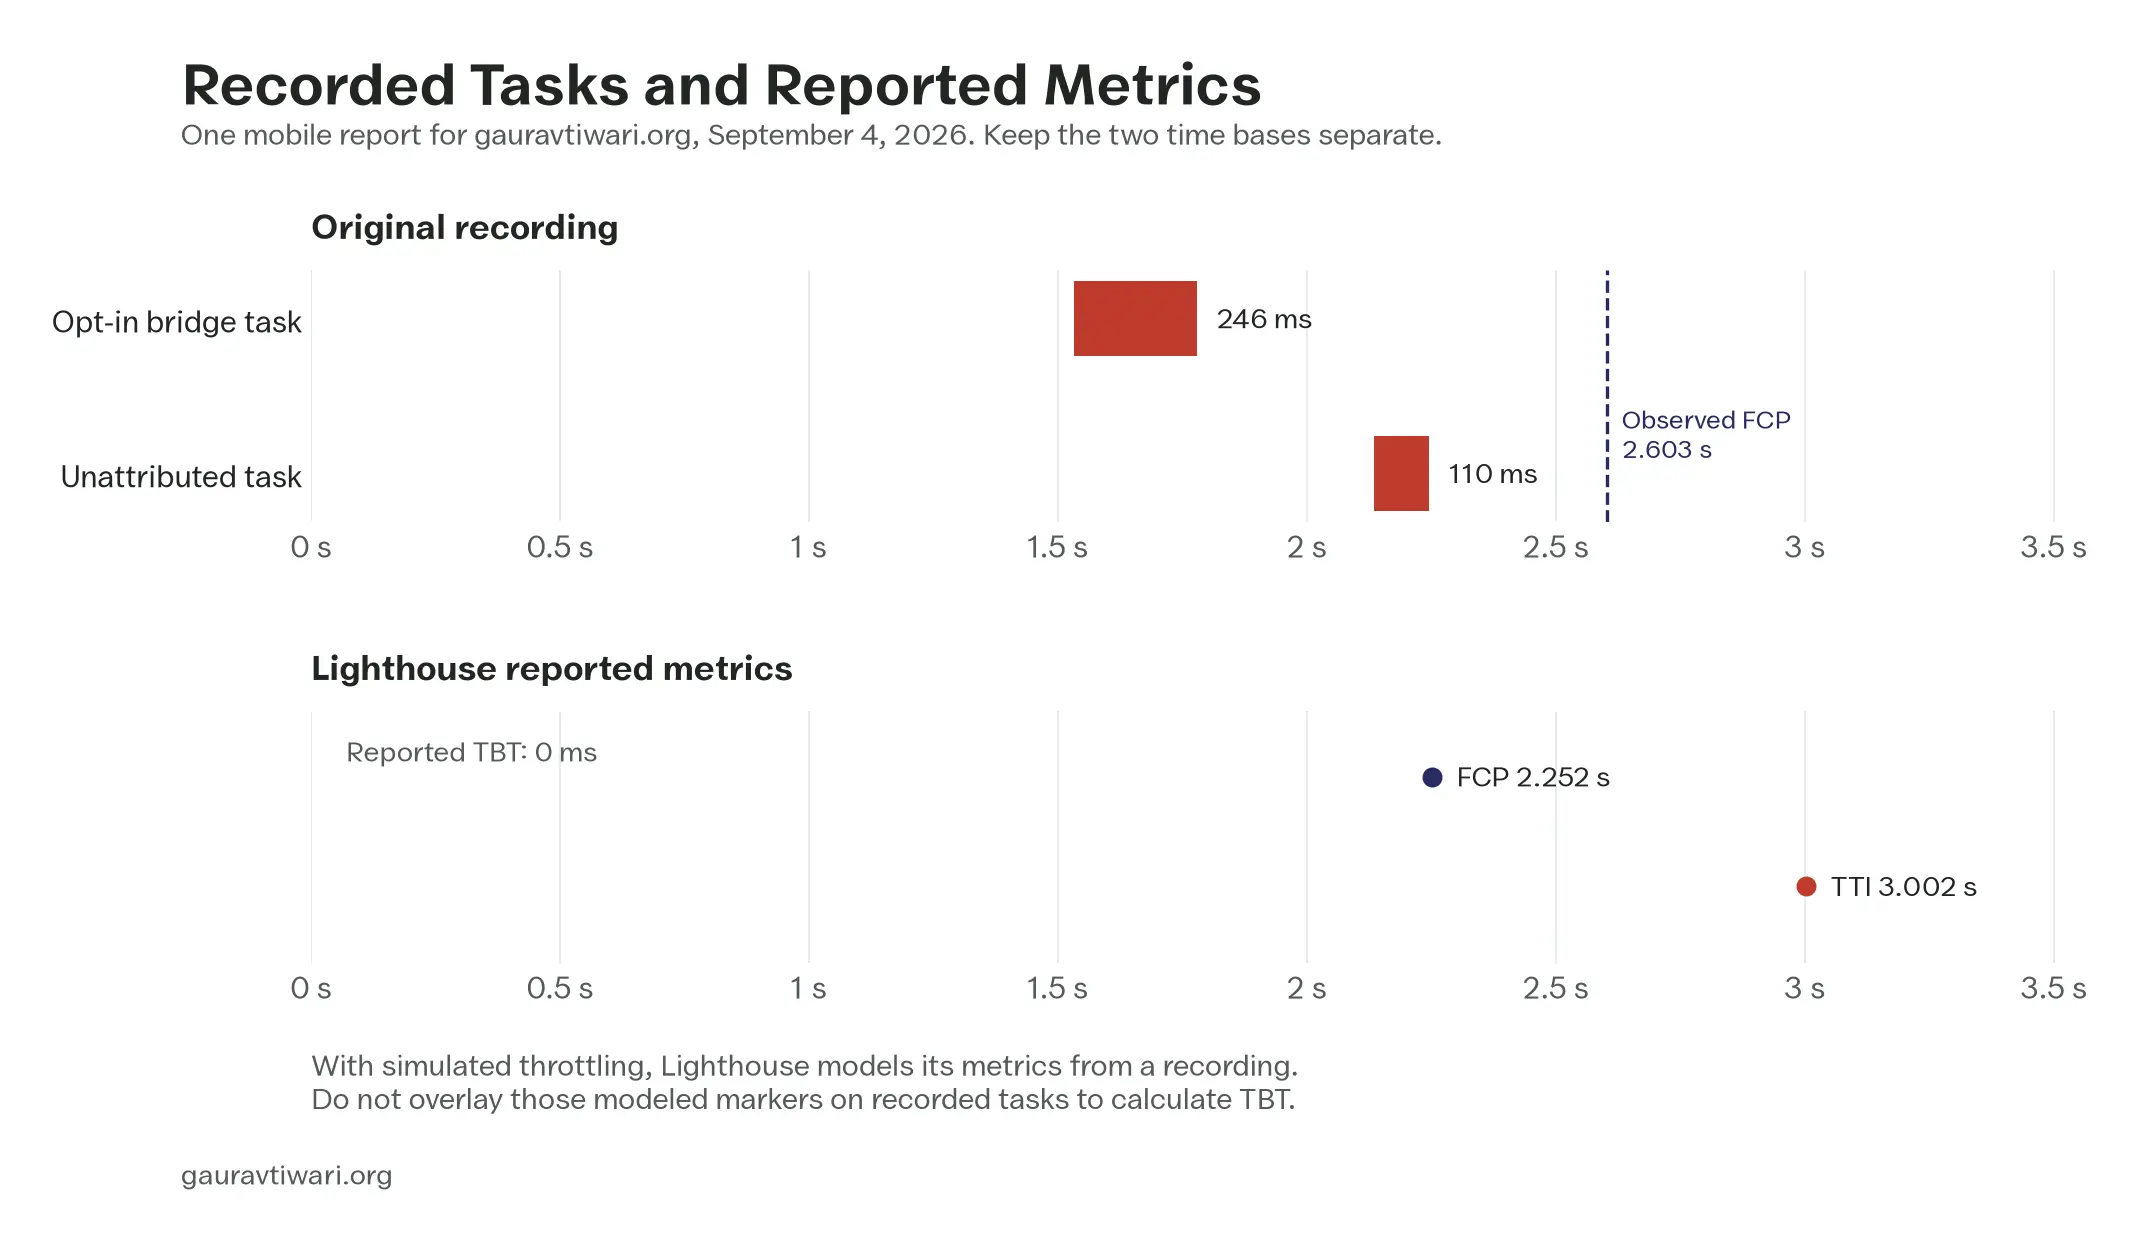
That report also listed a 246 ms task attributed to an opt-in bridge script. I would inspect the task and its dependencies before deciding whether to defer it. A long-task diagnostic and the reported TBT can differ because of the measurement window and Lighthouse’s simulated timings.
How to Find the Long Tasks
You should start with PageSpeed Insights on the page you want to improve. I would expand the relevant diagnostics and insights, then use a trace when the summary does not explain the blocking.
- Choose Mobile in PageSpeed Insights when investigating a mobile problem. Keep the same device and network preset across comparisons; it represents a test configuration rather than every visitor’s phone.
- Run several tests under comparable conditions. Three runs are a useful starting point; keep the median and the spread, and investigate large outliers.
- Open the long-task diagnostic, often labeled Avoid long main-thread tasks. Note the task duration and attributed URL, then inspect the trace for its timing and the work inside it.
- Review JavaScript execution and main-thread breakdown diagnostics where available. Distinguish script execution from style, layout and parsing before choosing a fix.
- Review unused JavaScript as a candidate for investigation. Code unused during a load test may still be needed when someone opens a menu, submits a form or changes a filter.
- Review third-party code and its initiators. A third-party script can be loaded by your theme, a plugin or another tag, so identify the feature responsible for it.
- Use the script treemap and coverage tools to inspect large bundles. Size helps prioritize investigation, but it is not a measurement of task duration.
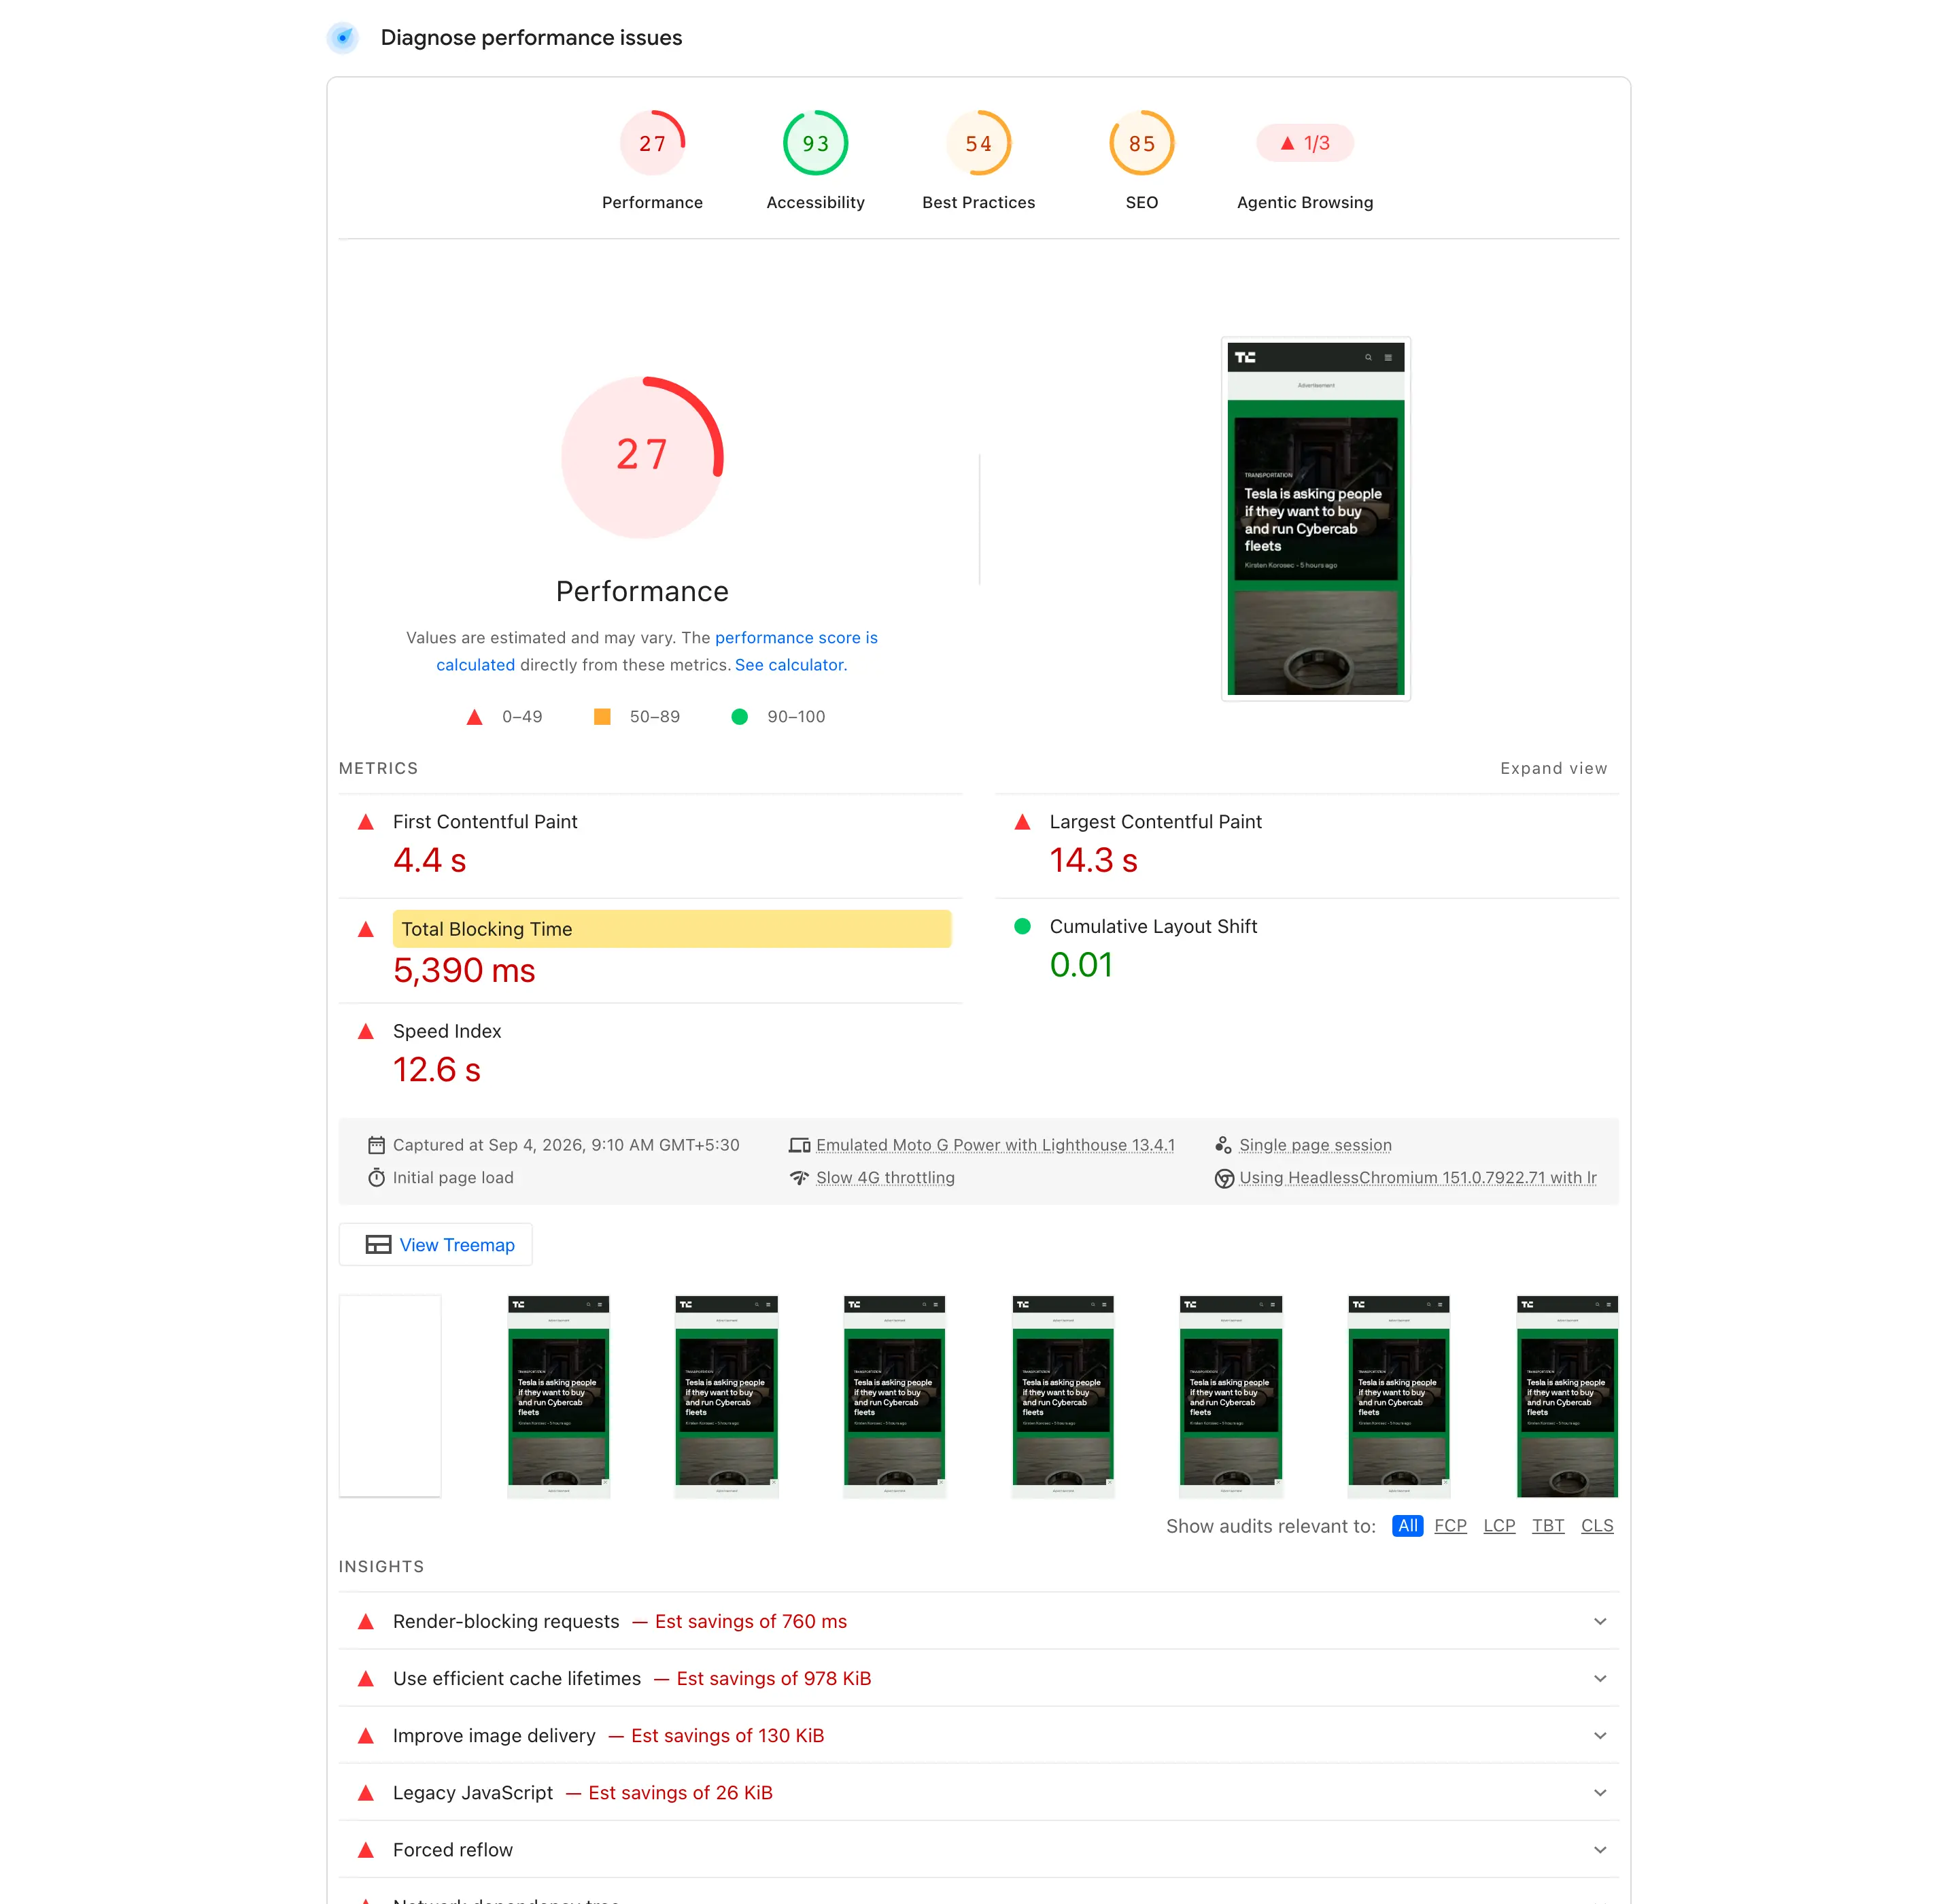
In the September comparison below, techcrunch.com’s TBT ranged from 1,180 to 2,366 ms across the selected results. I would check the scripts, content and test conditions behind a spread like that before deciding a change had helped or hurt.
You can record the load and relevant interactions in Chrome DevTools’ Performance panel to inspect long tasks and their call stacks. CPU slowdown is relative to your computer; a 4x setting does not reproduce every PageSpeed Insights device.
How to Reduce Total Blocking Time
I usually start by removing unnecessary work, then check loading strategies and the code that still runs. The trace decides the priority: a layout bottleneck needs a different fix from a marketing tag or an expensive click handler.
Remove the Scripts the Page Does Not Need
You should identify the feature behind each script on the affected page. I would remove an unused feature or unload its assets on that page before trying to optimize work the visitor never needs.
- Deactivate an unnecessary plugin only after checking the rest of the site. For a feature needed on a few pages, prefer targeted asset loading to disabling it everywhere.
- Use a script manager where appropriate. Perfmatters and Asset CleanUp provide asset-loading controls; check dependencies and test the pages where you disable an asset.
- Review optional emoji and embed features before disabling their assets. Remove jQuery Migrate only after checking compatibility; older code may still depend on it.
- Treat admin Heartbeat tuning as a separate server-load and editor decision. It supports features such as post locking and autosave and is not a general fix for front-end TBT.
GT Performance includes controls for optional WordPress assets and jQuery Migrate. For per-page unloading, I use a separate script manager; my WP Rocket vs Perfmatters comparison explains the roles. When GT Performance and Perfmatters are active together, you should check ownership for each overlapping JavaScript operation so both plugins do not transform the same scripts.
Delay Third-Party Scripts Until Interaction
Delay postpones selected scripts until an interaction or timeout. That can reduce work during the initial measurement window, but the scripts still need to load and execute. A timer may fire before a slow page finishes loading, and loading several scripts on the first tap can make that interaction slower.
GT Performance’s selected-script delay works through a loader. In the implementation behind these controls:
- A matching eligible external script has its
srcmoved todata-gtp-srcand its type changed totext/gtp-delayed. The loader can restore it later. - The loader starts on
pointerdown,keydownortouchstart, with a 5-second timeout as another trigger. - Restored external classic scripts have
asyncdisabled to preserve their execution order. That alone does not establish that every inline dependency or integration will still work. - The optimizer skips module scripts and URLs matching its exclusions, including common
cart,checkoutandpaymentfragments. Review your own dependencies too; a URL pattern cannot recognize every critical script.
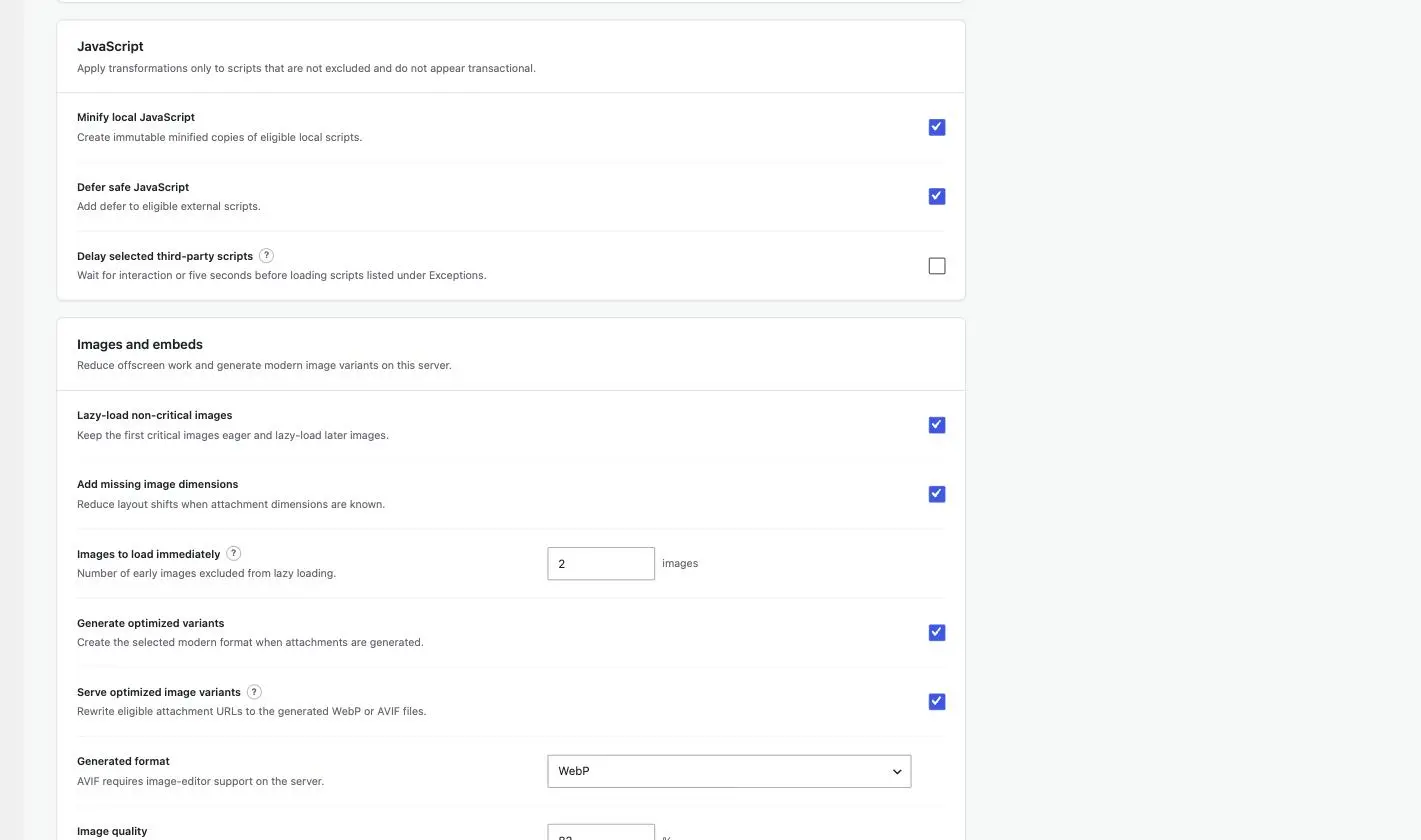
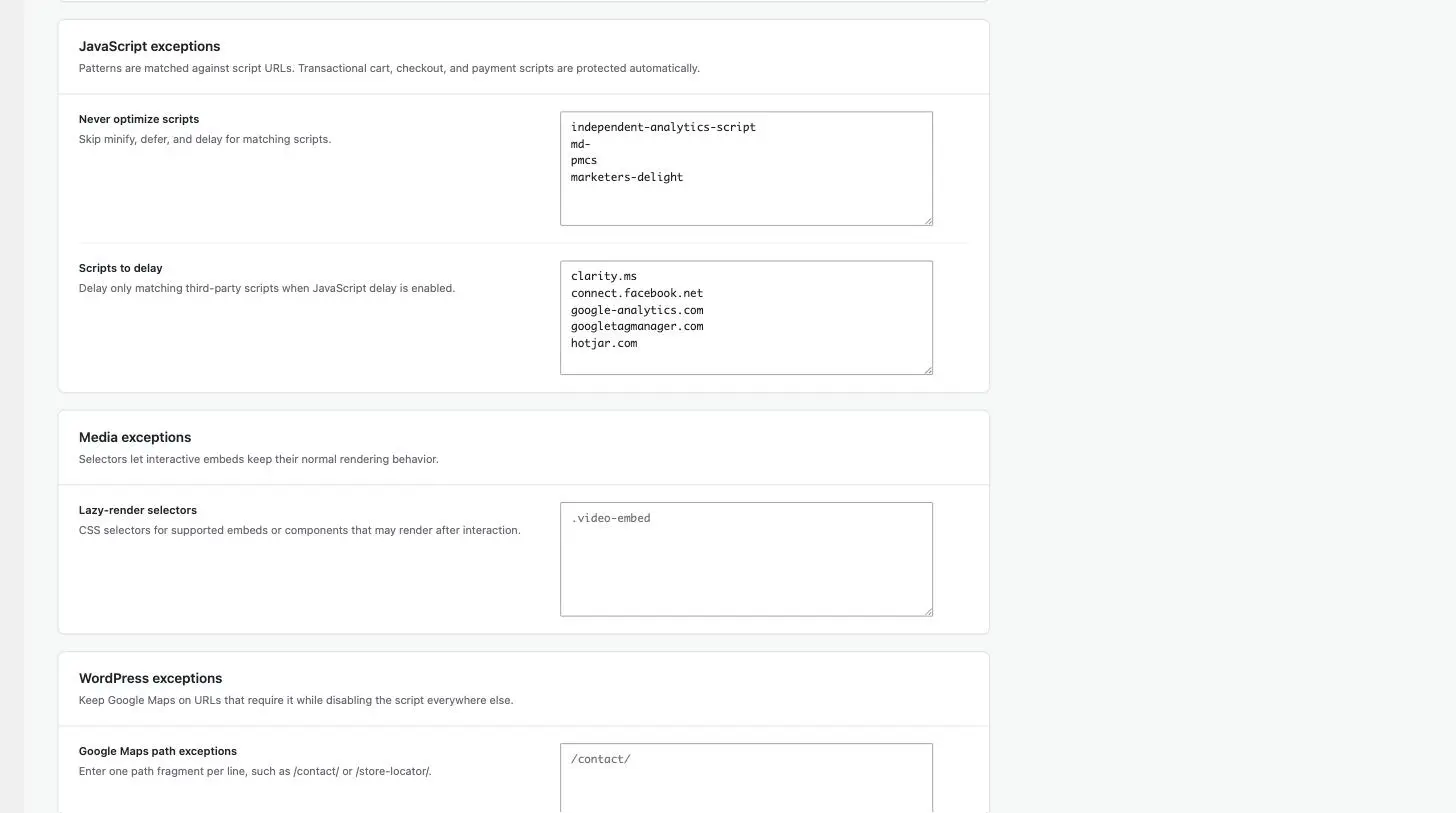
The controls shown are Delay selected third-party scripts and Scripts to delay under Exceptions. The supplied patterns include Google Tag Manager, Google Analytics, the Facebook pixel, Microsoft Clarity and Hotjar. You should treat these as possible matches, then check the scripts your site actually loads and any automatic exclusions.
I would start with a nonessential tag whose later loading is acceptable for the site. Keep navigation, forms, search, payment dependencies and consent controls available when the user needs them. A chat widget or ad script is not automatically safe to delay just because it comes from another domain.
Delaying analytics can miss visits that end before its trigger. Consent and event-order requirements can also change which tags must run together. I prefer deciding this per script, with the site’s measurement needs understood before changing when tracking starts.
Defer the Rest
For an external classic script, defer lets downloading happen alongside HTML parsing and schedules execution after parsing, in document order. It can remove parser blocking, but it does not split expensive execution into smaller tasks or guarantee an earlier paint. I would check dependencies before applying it.
GT Performance’s Defer safe JavaScript adds the attribute to eligible external scripts while respecting exclusions. Inline code that expects a library immediately can still break. You should check the affected interaction and console, then narrow the exclusion to the dependency that needs its original loading behavior.
For external classic scripts, defer downloads alongside parsing and executes afterward in document order. Async executes when ready without preserving that order. A delay loader waits for its trigger or timeout. Each changes scheduling; none guarantees a lower TBT or a fast first interaction. Check dependencies and measure the result.
Cut Unused JavaScript
A load-time coverage report shows which code was unused during that recording. I would also record the interactions the page supports before removing it. Then choose the fix according to who controls the code:
- Unload a plugin’s asset on pages that do not need the feature, keeping its dependencies in mind.
- Load an optional third-party feature when it is needed, if its timing and measurement requirements allow that.
- For your own code, split bundles, import features on demand or break up long work. For a vendor bundle, check its settings, updates and support options before considering a replacement.
- Minification can reduce transfer size, but it does not prove a task will execute faster. GT Performance can minify eligible local JavaScript; measure the effect separately from defer or delay.
A button or embed that is rarely used may be a good candidate for on-demand loading. I would measure the scripts it adds and test the first activation before putting it on a delay list. The visitor should not lose the action you kept the button for.
Fix the Theme and Builder Layer
When the trace points to a theme or builder feature, you should start with that feature’s asset-loading controls and the widgets the page uses. A lighter theme such as GeneratePress may suit a simpler site, but one vendor homepage does not establish how every site built with that product performs.
I would remove unnecessary motion, sliders or complex widgets before planning a rebuild. If the required feature still performs poorly, compare an alternative using the same content and interactions. Moving away from a builder is a larger decision than changing a loading attribute.
Tame Embeds, Fonts and Layout Work
For videos, a click-to-load preview can avoid loading the player before someone wants it. GT Performance provides this for eligible YouTube embeds. Its local-font and unused-CSS options address other loading and rendering costs. Test fonts, responsive layouts and dynamic states separately; removing CSS does not automatically resolve an expensive layout.
What Caching Does and Does Not Do for TBT
Page caching reduces server work, and a CDN changes asset delivery. Those changes can affect loading order and the measured TBT, but caching alone does not remove an expensive JavaScript operation. I would use the trace to decide whether the remaining problem is computation, delivery or both. My guide to WordPress cache plugins by hosting stack covers the caching choice.
An earlier first paint can change which work falls inside the measurement window. That is one reason TBT can move after a delivery change. I would compare the timings and actual interaction behavior before deciding that either the cache or the JavaScript caused the difference.
Setting Up GT Performance for This
You should configure GT Performance’s JavaScript features around the tasks you found on your page, with a separate script manager when you need per-page unloading. I would back up first and use staging for changes that may affect interactions.
- Review existing cache ownership before installing the page-cache drop-in. Keep the cache state comparable when testing; a cache does not make separate runs identical.
- Review emoji, embed and jQuery Migrate controls individually. Disable only what your site can do without, then check the relevant pages and features.
- Try minification and defer separately. Test representative templates, menus, forms and checkout, and inspect errors before adding a precise script exclusion.
- Use lightweight YouTube previews when they suit the embed. Review local font hosting and CSS changes separately from the JavaScript experiment.
- Consider selected-script delay only after deciding which scripts can load later. Check consent behavior, event order, analytics collection and the first interaction.
- If another optimizer is active, use the Integrations controls to assign each overlapping job to one owner. Per-page asset unloading remains a separate task.
- Compare repeated runs before and after, retaining the spread and diagnostic details. Test interactions alongside the loading metrics.
You can download GT Performance and follow its setup instructions on the product page, or inspect the source on GitHub. The store package uses a license activation for automatic updates, so you should follow the instructions for the package you install. The GT Performance review on Gatilab covers the plugin beyond JavaScript loading.
Checking the Result
After each change, you should compare the same page under the same test preset and repeat the interactions that matter. A task can become shorter without disappearing from the list, and moving work can change the metric too. I would inspect those differences before dismissing a change as variance or calling it a fix.
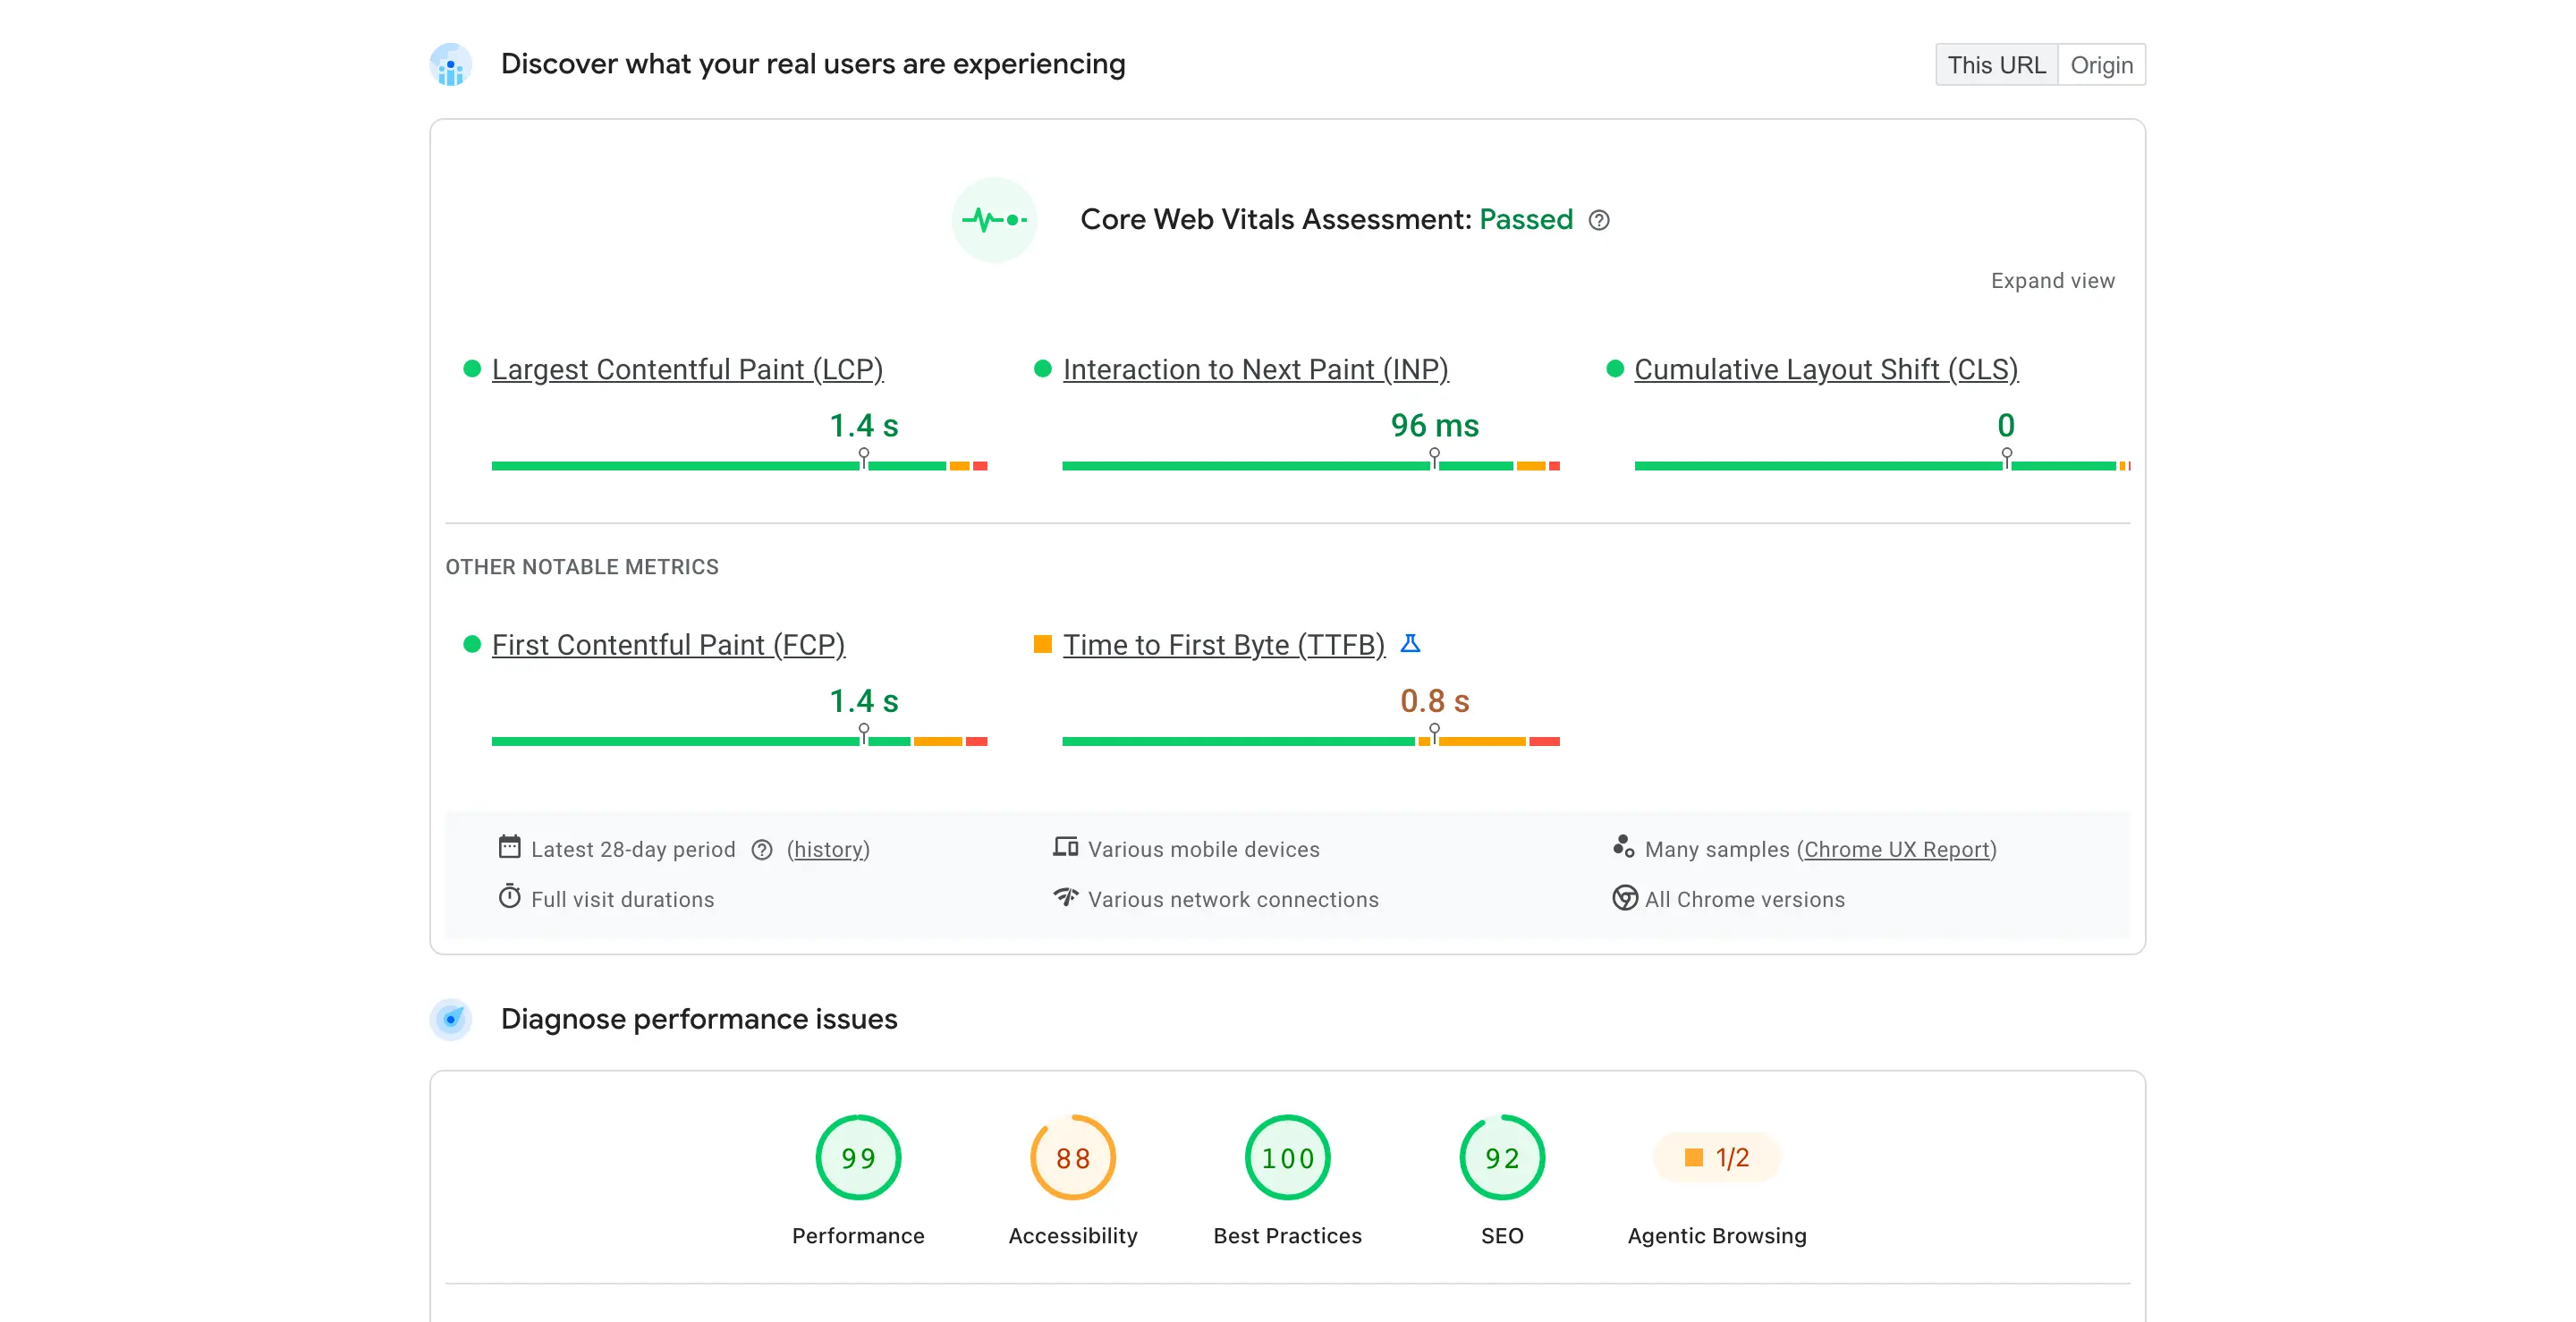
Search Console’s Core Web Vitals report is useful for the field picture; my guide to passing Core Web Vitals explains how to read it. Its rolling 28-day data can reflect changes gradually, and URL grouping or origin-level fallback affects the scope. Your own real-user monitoring can reveal new interaction problems sooner. A good 75th-percentile INP does not mean no visitor had a slow interaction.
The Same Test on 10 WordPress Sites
On September 4, 2026, I compared my 2 sites with 8 other WordPress homepages using the mobile PageSpeed Insights preset. The table reports medians and the spread of 3 results per homepage. These are historical observations of different pages and stacks, so they cannot isolate the effect of a particular plugin, theme or host. Main-thread time, task counts and script totals are separate summaries, not necessarily values from one run.
| Site | Stack | Median TBT | Run spread | Main thread | Long tasks | Scripts | Field INP |
|---|---|---|---|---|---|---|---|
| gauravtiwari.org | Marketers Delight theme, GT Performance with Perfmatters | 0 ms | 0 ms | 0.8 s | 1 | 11 (45 KB) | 147 ms |
| anantamias.com | Bricks with FluentCart, no script optimizer | 0 ms | 0 ms | 1.9 s | 2 | 15 (150 KB) | 196 ms |
| onlinemediamasters.com | GeneratePress, FlyingPress with Perfmatters, LiteSpeed | 0 ms | 0 ms | 0.2 s | 0 | 9 (10 KB) | 113 ms |
| wpbeginner.com | Custom theme, Perfmatters delay, Clarity | 0 ms | 0 ms | 0.3 s | 0 | 2 (14 KB) | 164 ms |
| wp-rocket.me | WP Rocket delaying 9 third-party scripts, GTM, pixels, Hotjar | 0 ms | 0 to 42 ms | 0.2 s | 0 | 0 (0 KB) | 96 ms |
| elementor.com | Elementor Pro on the Hello theme, jQuery, Weglot | 60 ms | 0 to 118 ms | 2.0 s | 5 | 37 (441 KB) | 365 ms |
| wordpress.org | Custom block theme, Gutenberg plugin, GTM | 144 ms | 134 to 421 ms | 0.7 s | 2 | 9 (337 KB) | 126 ms |
| kinsta.com | Custom theme, Ketch consent, Stripe, Wistia | 286 ms | 272 to 492 ms | 2.7 s | 10 | 28 (1162 KB) | 269 ms |
| yoast.com | Custom theme, WooCommerce, GTM with 3 Google tags | 369 ms | 201 to 568 ms | 1.8 s | 7 | 24 (968 KB) | 223 ms |
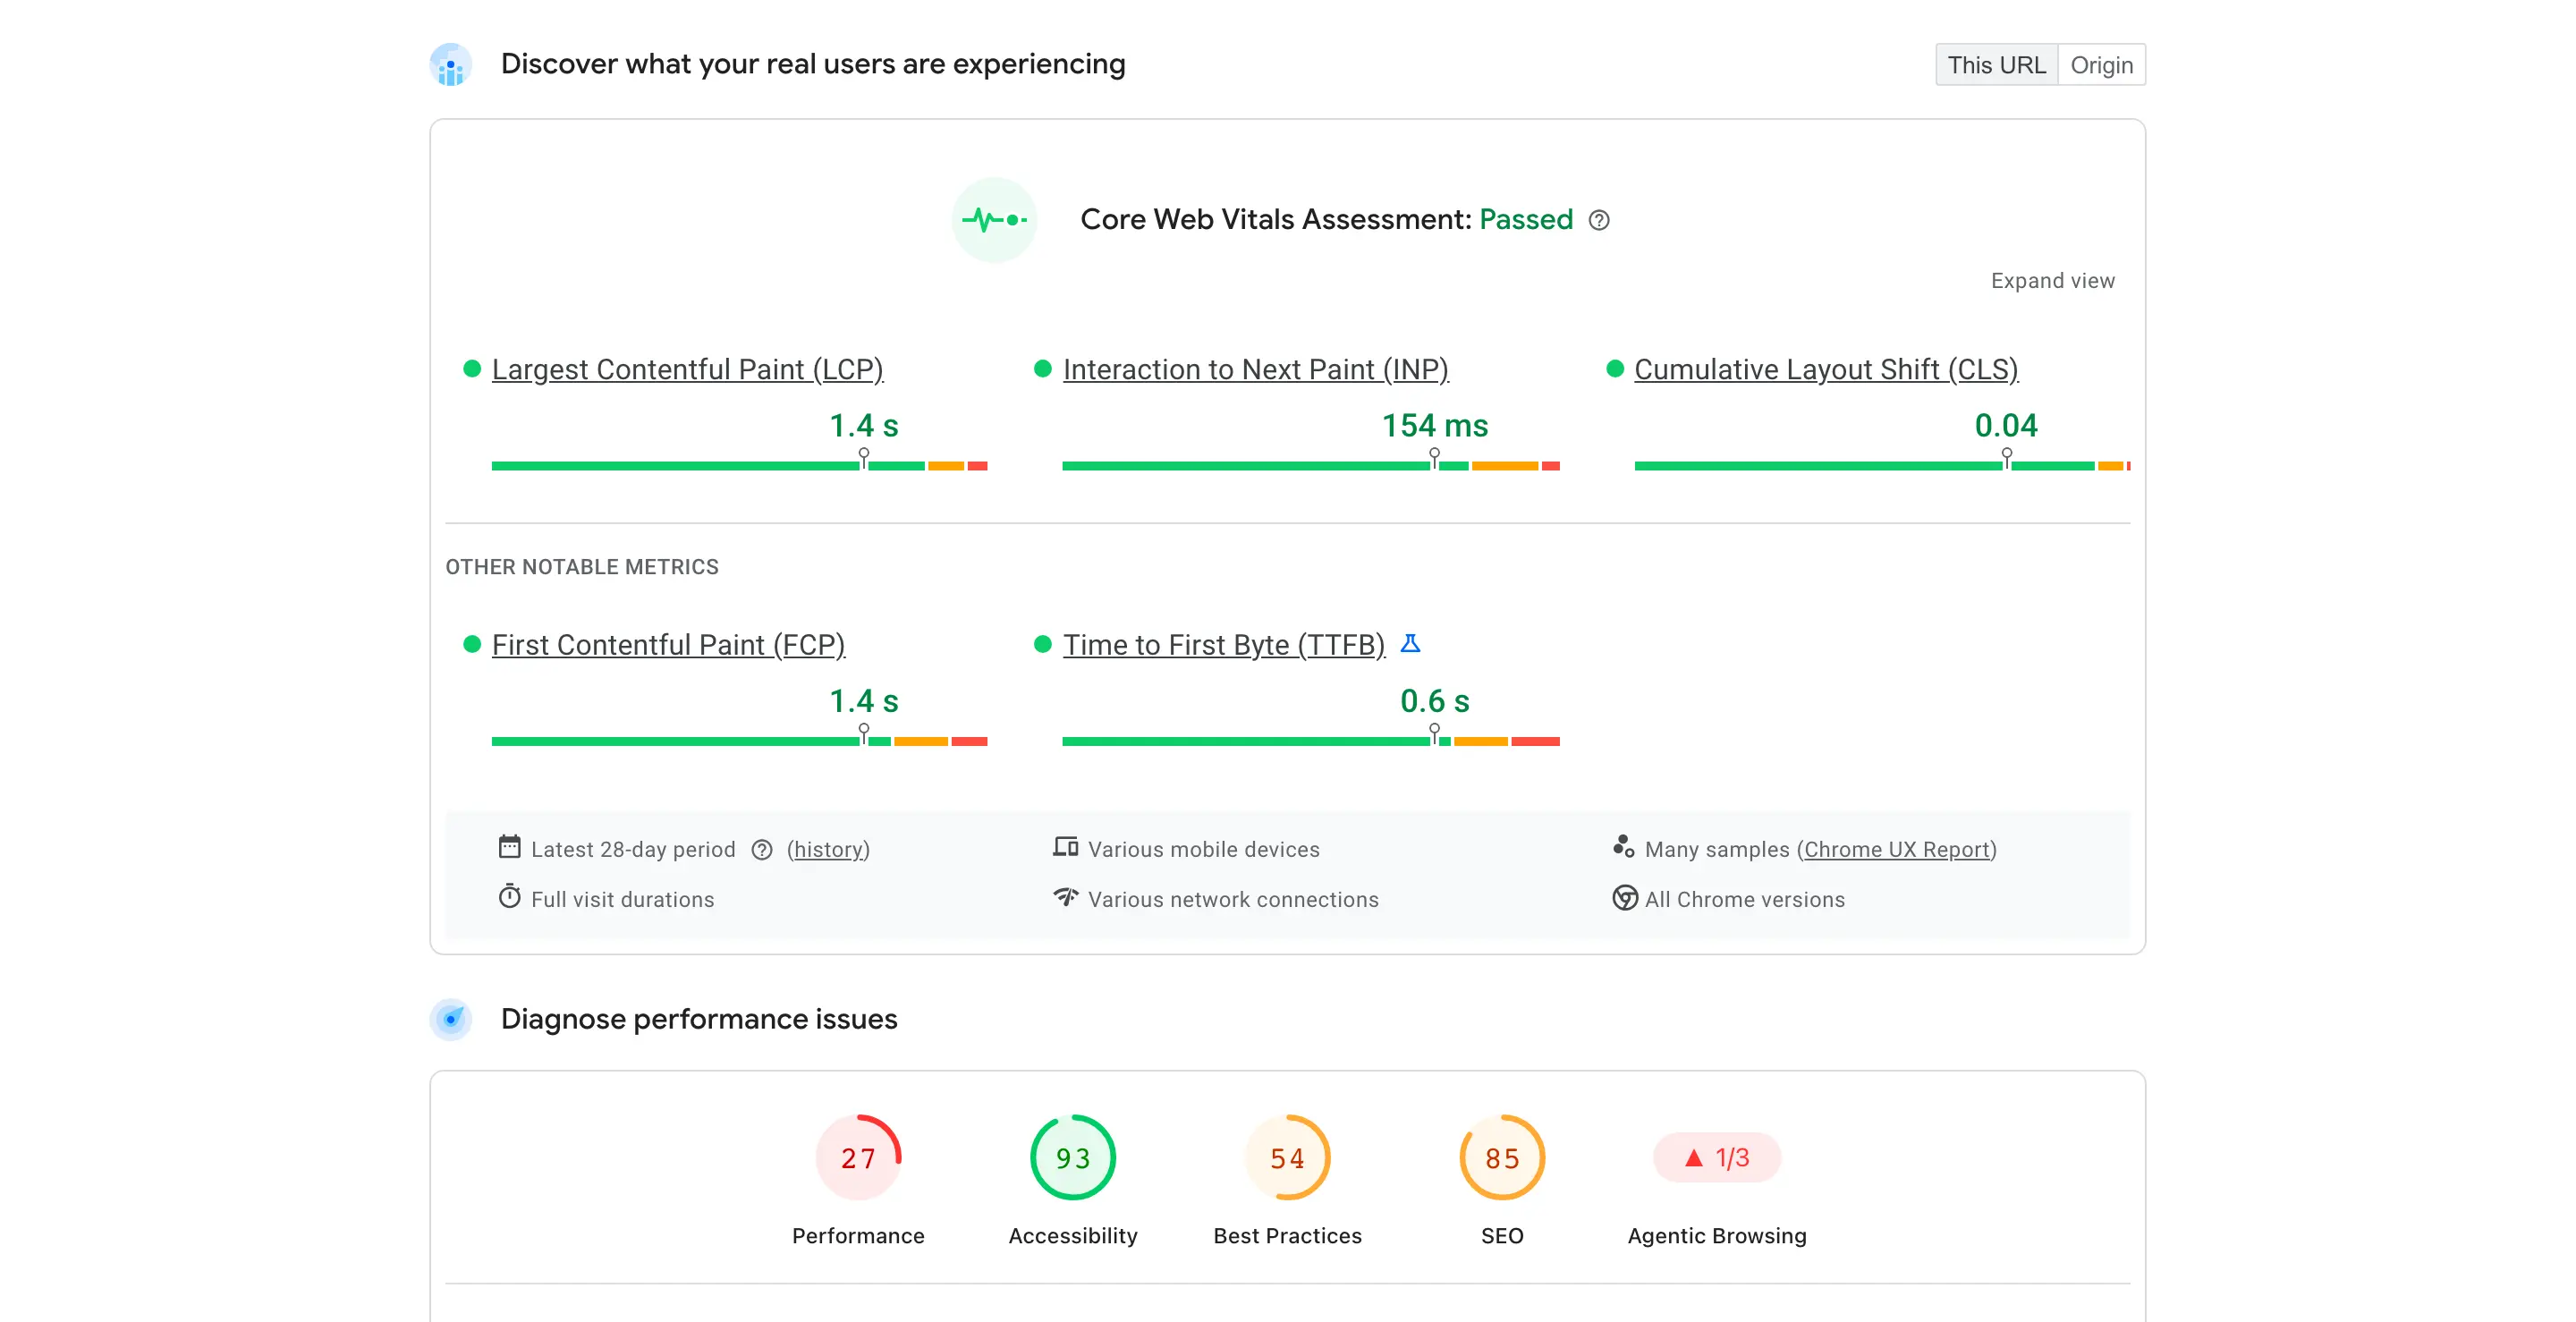
| techcrunch.com | Custom theme, GTM, JW Player, reCAPTCHA, ad consent | 1,964 ms | 1,180 to 2,366 ms | 9.0 s | 20 | 79 (2778 KB) | 154 ms |
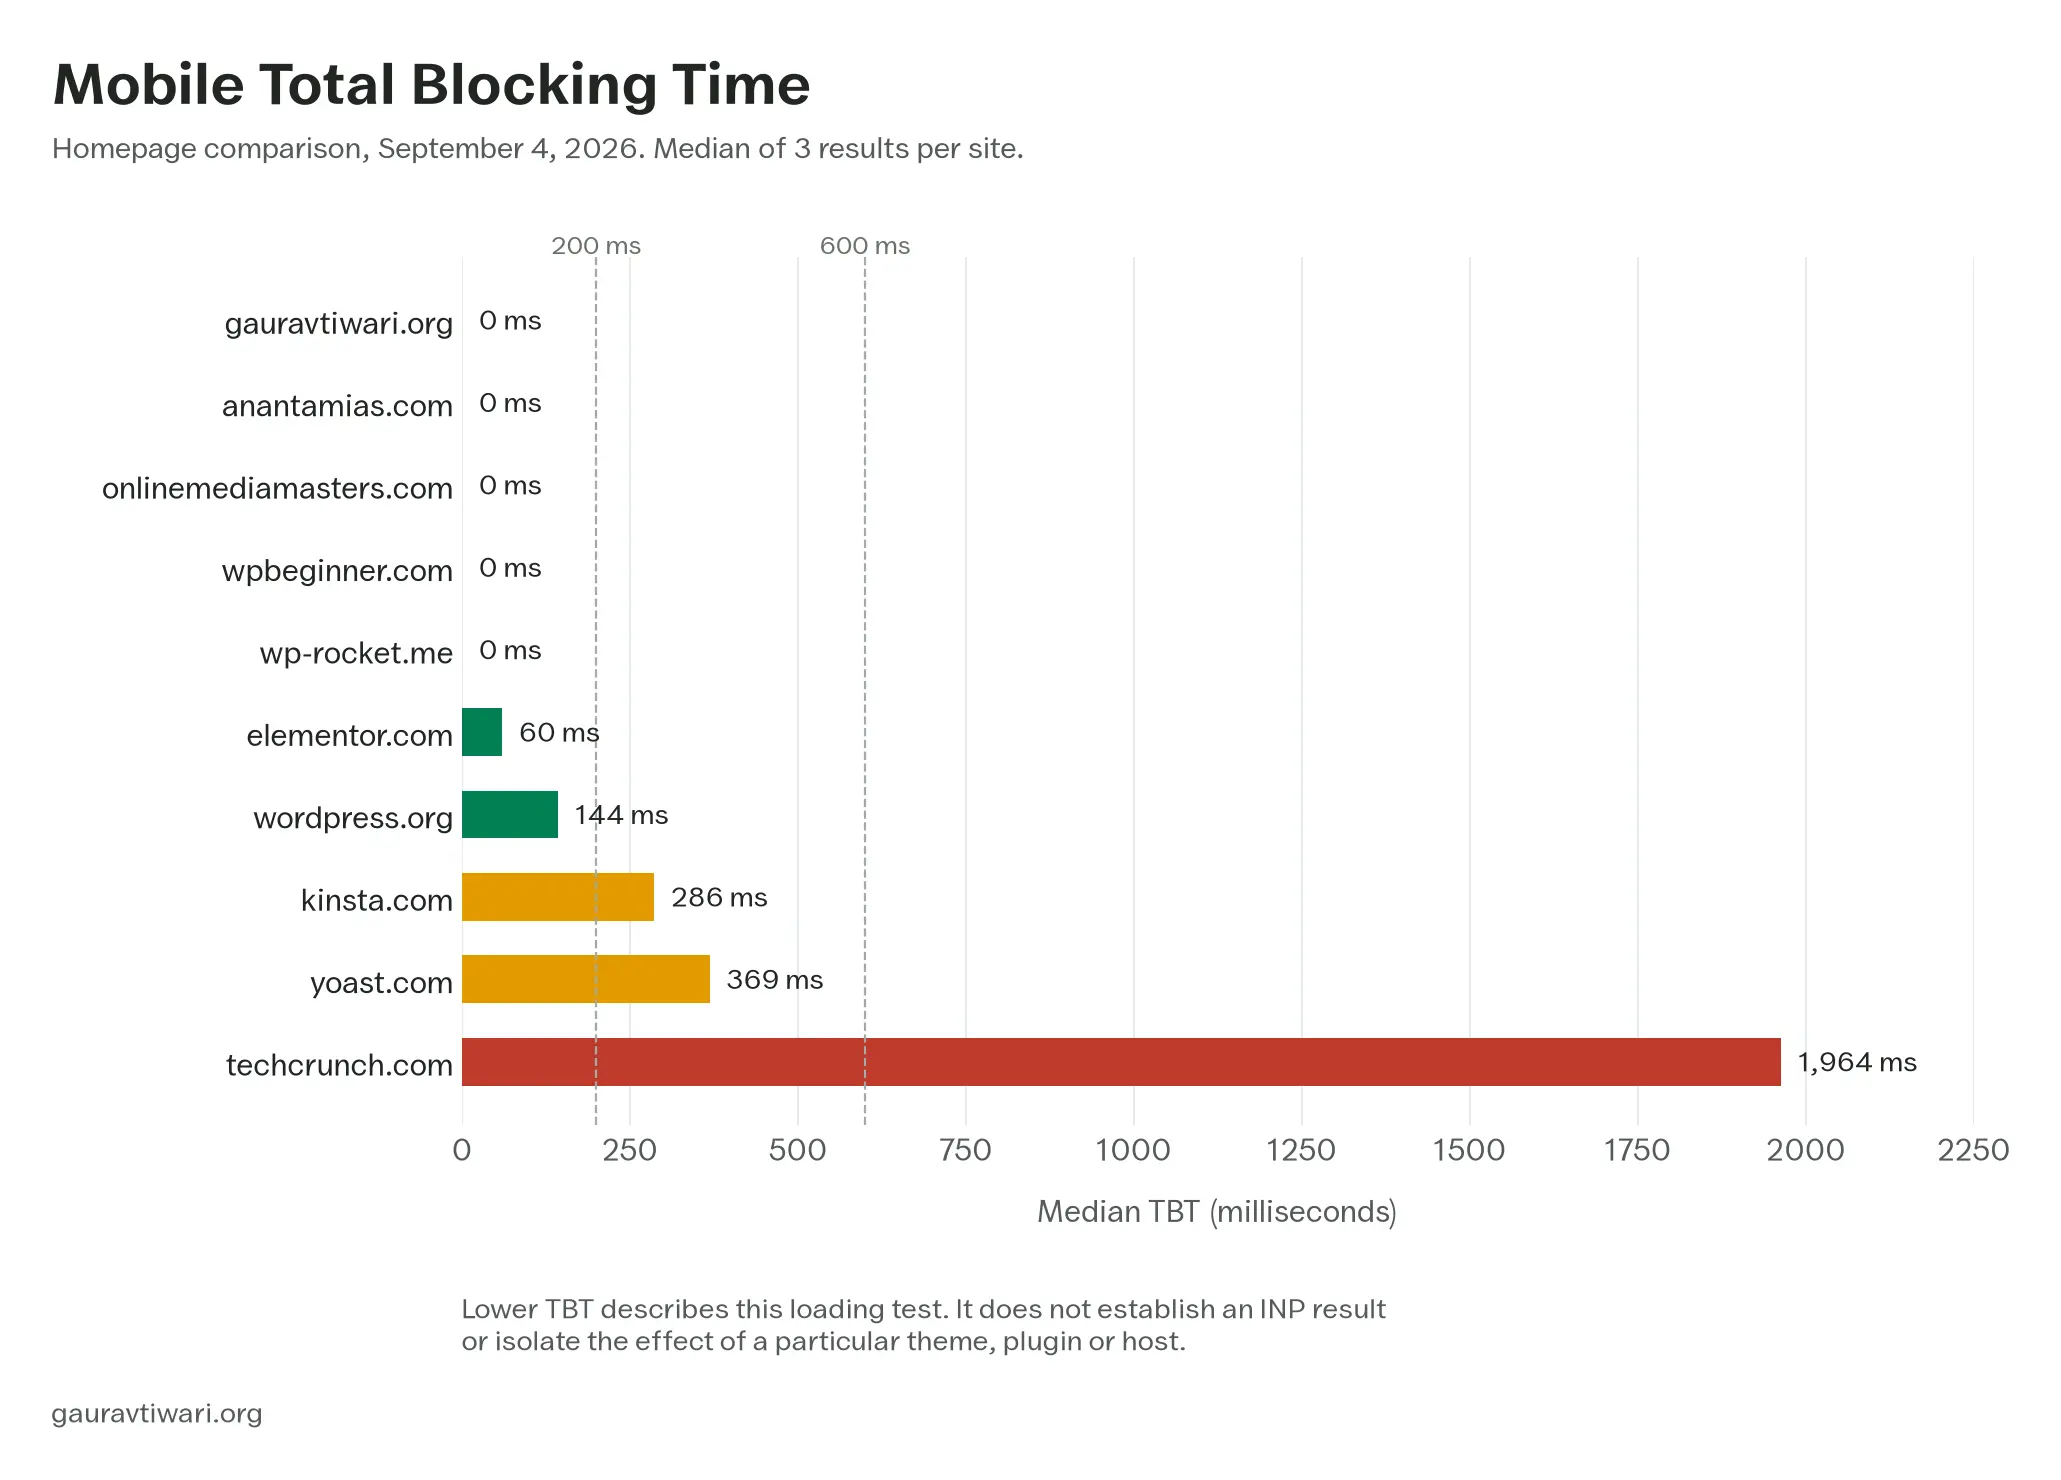
The median TBT ranged from 0 to 1,964 ms. I would use that spread to choose which reports need investigation, then inspect their tasks and page requirements. Neither the page’s download size nor the name of its optimizer explains the result on its own.
Main-Thread Work by Site
The category breakdown helps me decide whether to inspect JavaScript, rendering or other work first. It comes from a representative report for each homepage, so its totals can differ from the independent medians in the table.
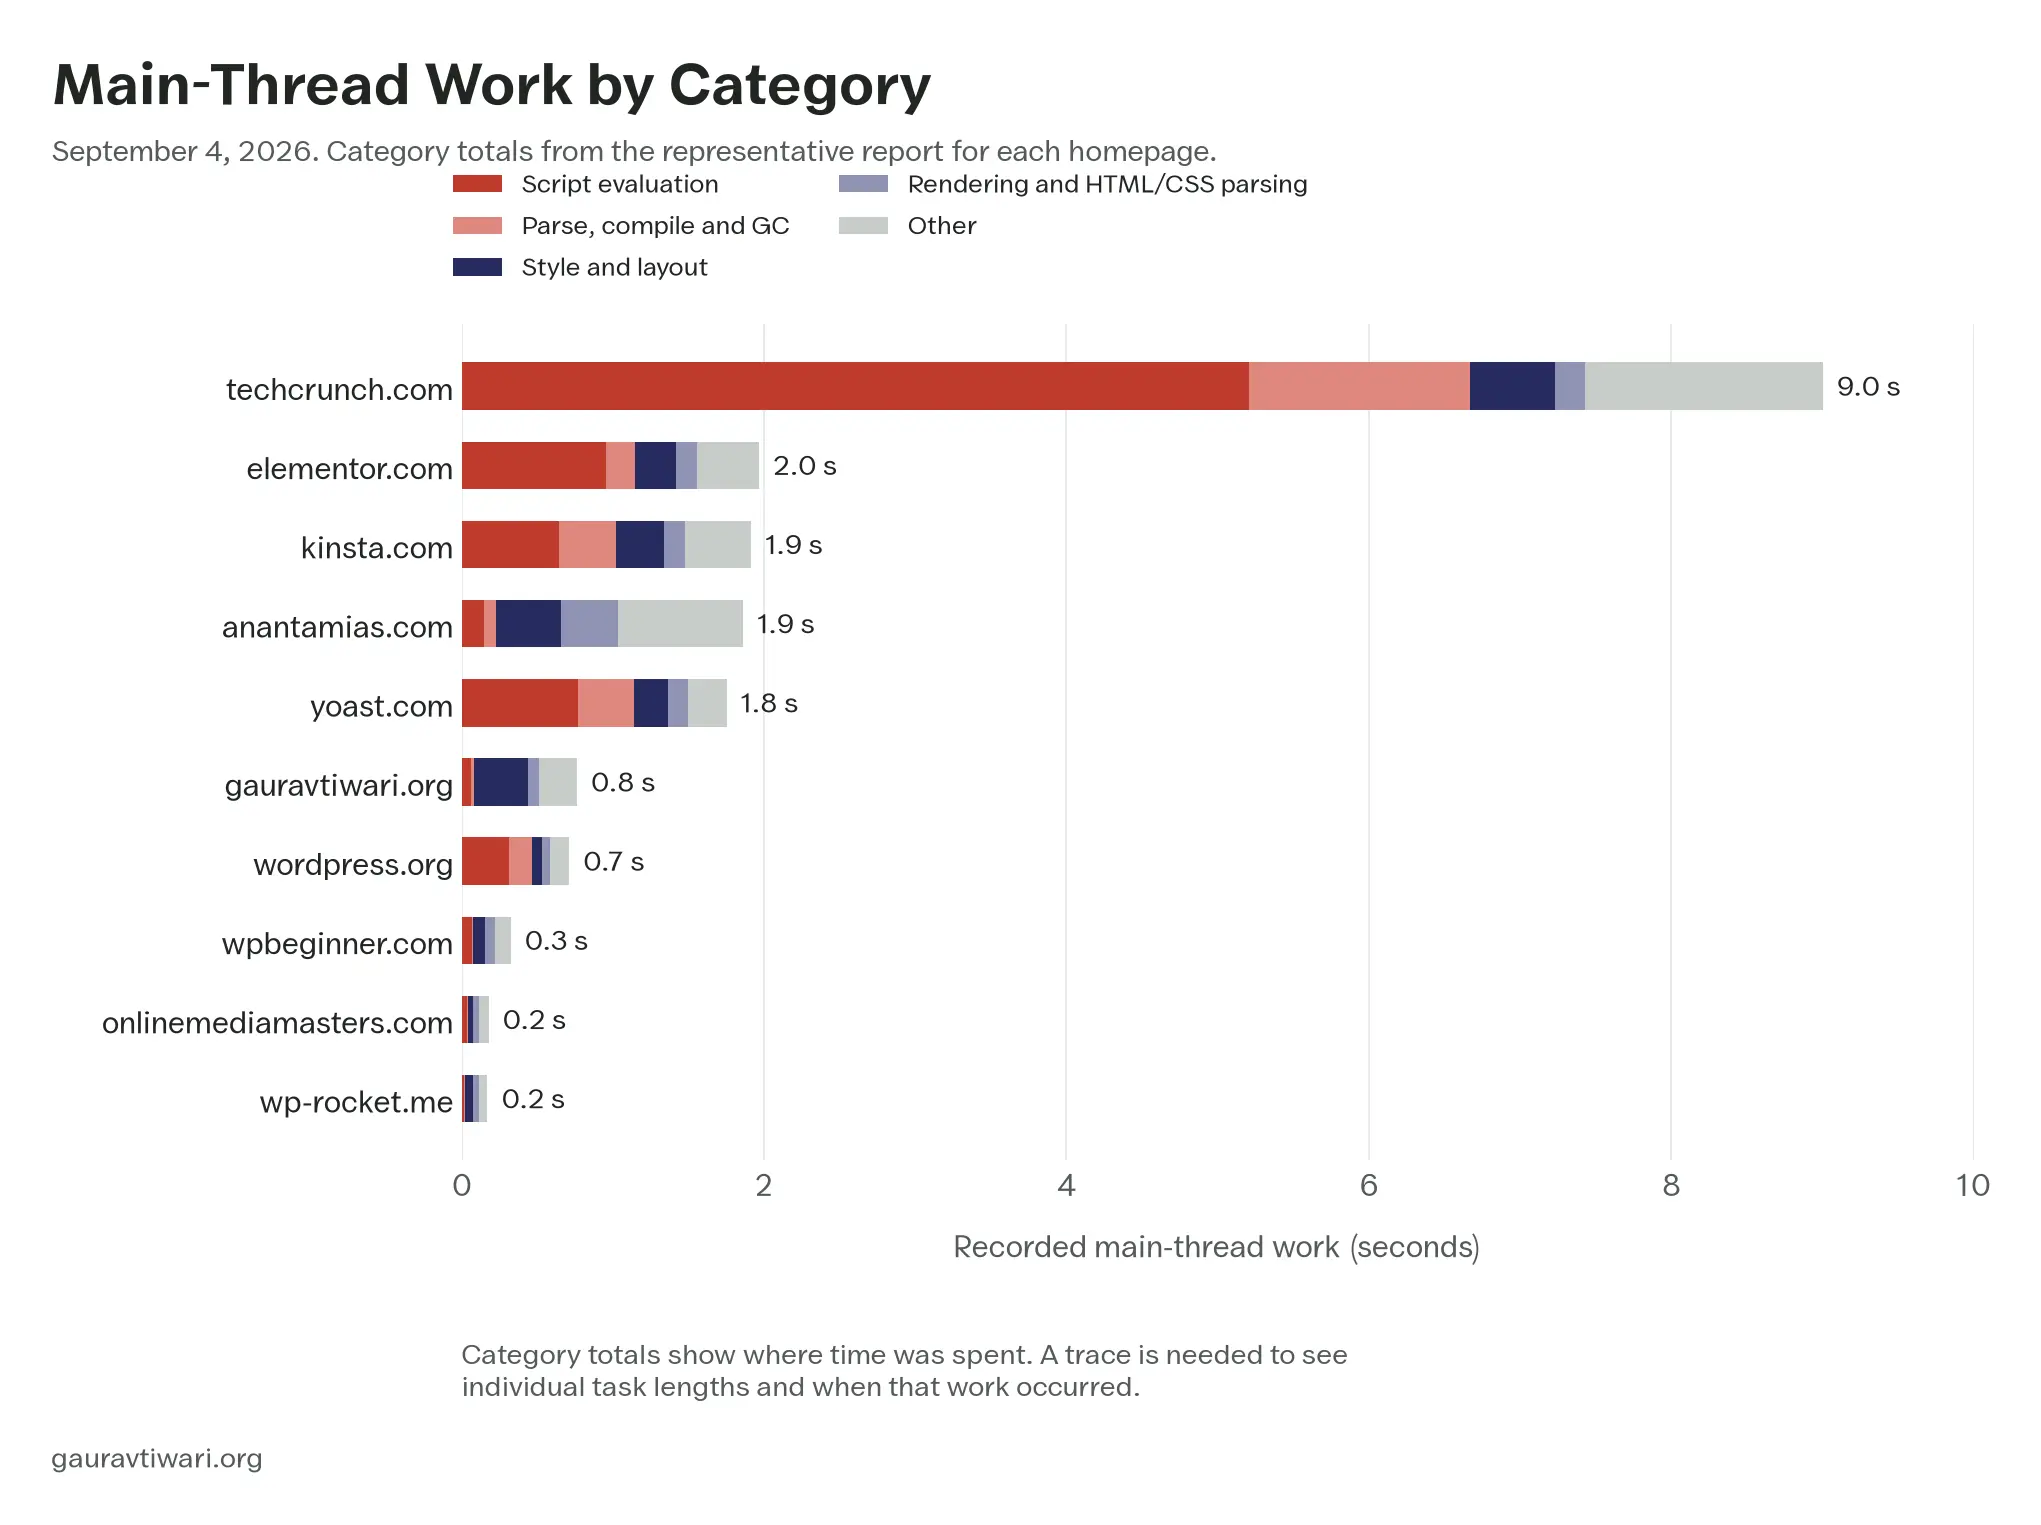
TechCrunch’s representative report spent most of its recorded main-thread time in script evaluation, parsing and compilation. That makes scripting a useful place to investigate. I would still open the trace before assigning its TBT to a particular file or assuming that layout work cannot block.
My 2 homepages returned 0 ms TBT in the selected results, while their diagnostics still recorded main-thread work and some long tasks. Anantam IAS had 15 detected script requests and limited loading transformations in the saved page inspection. That is an observation about that homepage, not a benchmark for every Bricks or FluentCart site.
OnlineMediaMasters recorded about 0.2 seconds of main-thread work and 9 script requests. I would treat the small amount of work as a reason to inspect what that page omits, without attributing the result to one product in its stack.
WPBeginner and WP Rocket had 0 ms median TBT, and the saved page inspections identified delayed scripts. A load-only test may not trigger those scripts. I would record the first interaction to see when they start and whether they interfere with the action.
WordPress.org recorded 144 ms median TBT, with results from 134 to 421 ms. The saved task summaries attributed its listed long tasks to Google Tag Manager and gtag. I would test their contribution in isolation before predicting the result of removing them.
Yoast recorded 369 ms median TBT, with results from 201 to 568 ms. Google tag scripts appeared in the retained long-task summaries, making the container and its triggers a useful place to begin an audit.
Kinsta recorded about 286 ms median TBT, with results from 272 to 492 ms. Its saved summaries repeatedly listed the Ketch consent SDK and Stripe among long tasks. I would identify the work each integration is doing and why the page needs it before changing its loading behavior.
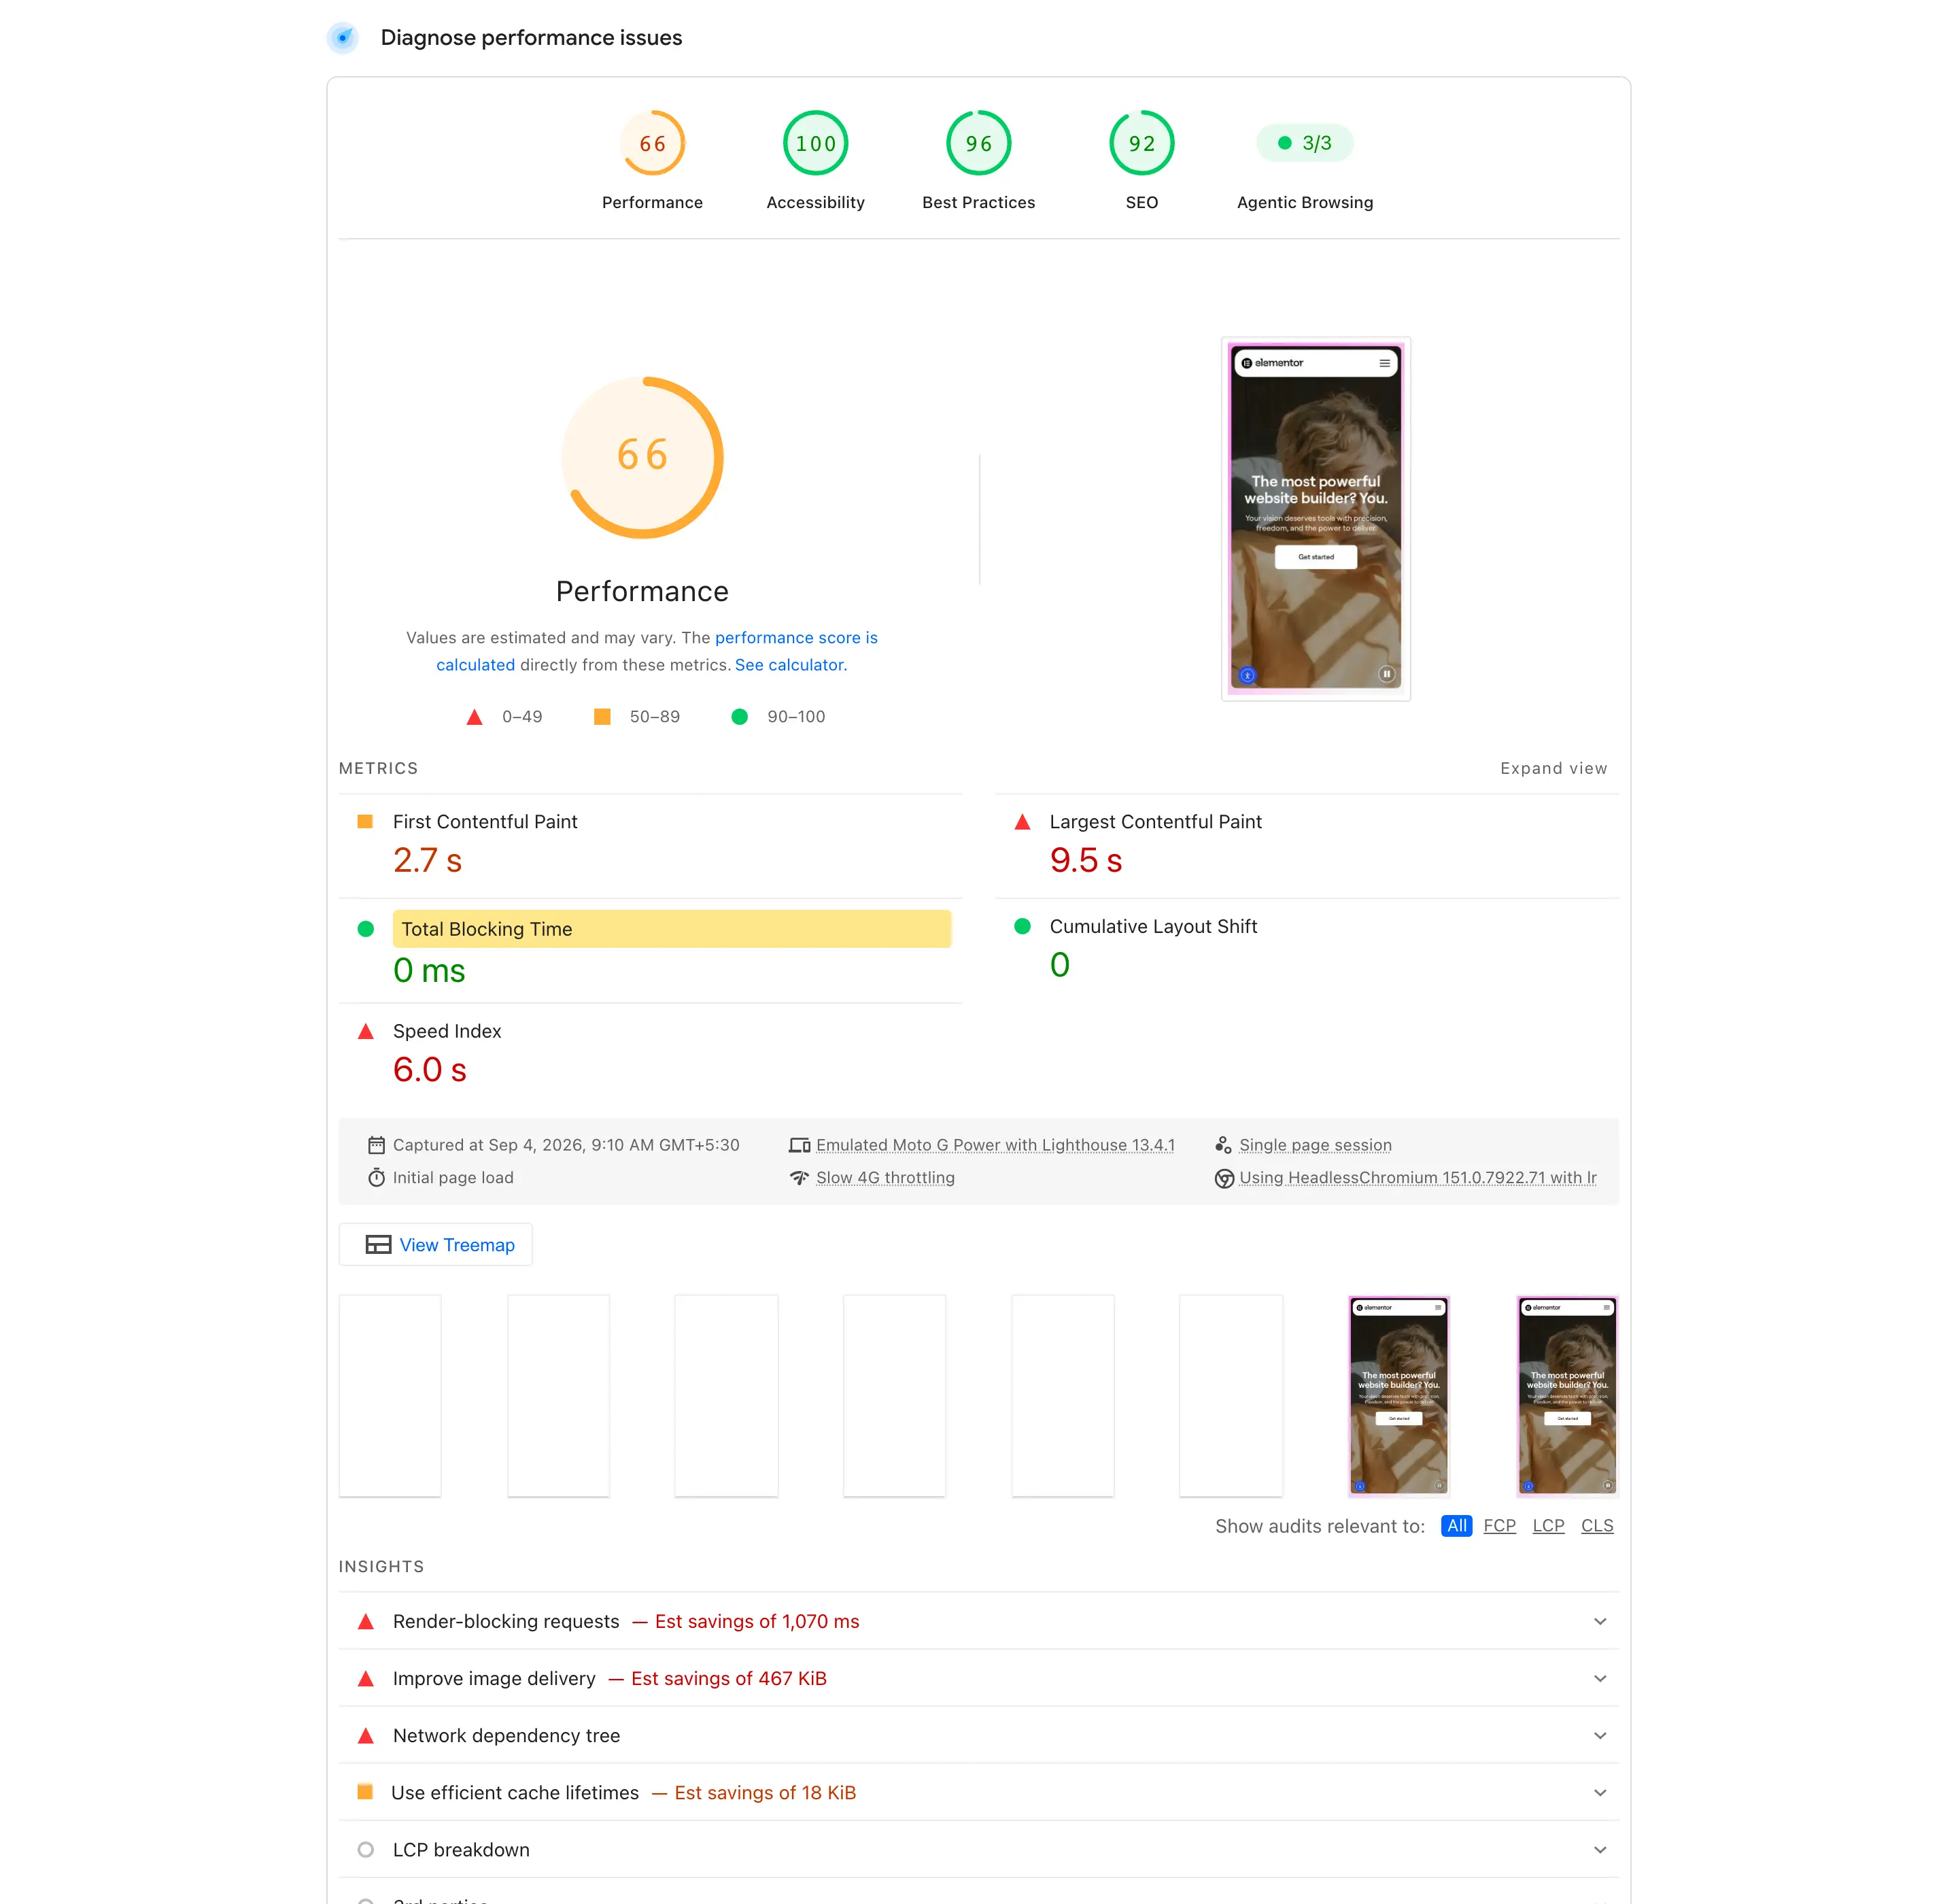
Elementor’s homepage recorded 60 ms median TBT and a 0 to 118 ms spread, alongside a reported field INP of 365 ms. That difference is a reason to investigate interactions after load. It does not establish that a particular builder feature caused the field value.
TechCrunch recorded 1,964 ms median TBT and a 1,180 to 2,366 ms spread. Google tags, consent-related code and reCAPTCHA appeared across the saved task summaries. Its reported field INP was 154 ms, showing how the load test and real-user aggregate can differ.
Explaining the Differences
I would use the comparison to form hypotheses, then test those hypotheses on the affected site:
Transfer size and blocking time measure different costs. Elementor’s page transferred about 6.5 MB while its median TBT was 60 ms; Yoast’s transferred about 1.6 MB with 369 ms TBT. I would inspect execution and task timing alongside the download size.
Third-party tags deserve their own inventory. Several reports attributed long tasks to Google tags. You should check which integration adds each tag, when it fires and whether it duplicates another measurement. A tag manager’s cost depends on what the page loads and executes.
Consent controls need their dependencies preserved. You should keep the consent interface available and maintain the intended order of consent signals and dependent tags. I would investigate a heavy consent SDK’s configuration or alternatives before considering any delay.
Delay needs an interaction test. Low load-time TBT on WP Rocket and WPBeginner does not measure everything that happens when a visitor taps. I would record that first action and check whether the newly released scripts postpone its response.
A good load result can coexist with slower interactions. Elementor’s historical TBT and INP figures illustrate the gap. You can use interaction measurements to identify the handler and rendering work involved; the homepage load report cannot assign the cause by itself.
Keep the spread. A median is useful, but the TechCrunch, WordPress.org and Elementor results varied within the sample. I would compare repeated results and their traces before treating a small difference as an improvement.
Reading Lighthouse Timings
A network waterfall shows requests and downloads; the main-thread trace shows when work executes. Lighthouse’s default simulated throttling derives metrics from a recording, so reported FCP and TTI can differ from the original trace. I would keep those time bases separate when explaining a task’s contribution.
| Recorded Measure | gauravtiwari.org | techcrunch.com |
|---|---|---|
| Median TBT | 0 ms | 1,964 ms |
| TBT spread | 0 ms | 1,180 to 2,366 ms |
| Median main-thread work | 0.8 s | 9.0 s |
| Median script requests | 11 | 79 |
| Median script transfer | 45 KB | 2,778 KB |
| Reported field INP | 147 ms | 154 ms |
These loading summaries show why I would investigate different things on the 2 sites. They do not reconstruct either report’s TBT from a waterfall.
For the lighter homepage, I would inspect the remaining long tasks and make sure changes preserve the forms and navigation. For the publisher, I would begin with the tags and dependencies responsible for its larger scripting workload.
When tracing a specific interaction, you should use the task and paint timings from the same recording. A response can wait for work already running, spend time in an event handler and then wait for the next paint. Improving one part does not guarantee the others are fast.
The saved homepage recording illustrates the distinction: its long-task diagnostic included a 246 ms opt-in bridge task, while the report showed 0 ms TBT. I would inspect the matching recorded timeline and simulated result before interpreting that combination.
I would use the lab to locate expensive work and real-user measurements to judge how often it affects visitors. Device speed is one possible reason for different results, alongside the interactions, page state, consent, geography and reporting scope. The aggregate alone cannot tell us which explanation applies.
The Way Forward for Each Kind of Site
You should choose the first change around the work your report identifies and the features the page must keep:
A lightweight blog: preserve its small amount of work and inspect new assets when adding features. Even with 0 ms load-time TBT, I would check a listed long task and test the interaction that uses it.
A site with little optimization: establish a repeatable baseline before installing another plugin. Anantam IAS passed the historical load test with a reported INP of 196 ms. I would test its real interactions first, then enable only the loading or CSS changes that address a demonstrated problem.
A tag-heavy marketing page: inventory the container, triggers and consent dependencies. Remove unused or duplicate tags, and load optional integrations only where and when the page needs them. Verify the measurement and payment-related flows after changing those rules.
A builder site: inspect the relevant widgets, event handlers and rendering work. Start with supported asset-loading settings and unnecessary visual effects, then compare lab and field interaction results before considering a rebuild.
An advertising-supported publisher: preserve necessary consent and monetization behavior while measuring expensive tags and embeds. Test lazy or on-demand loading where it suits the feature. A passing field aggregate is not a reason to ignore slow users or expensive individual interactions.
A site using script delay: test immediately after load and again after the fallback timer. Tap the menu, use search and submit a form. I would watch for queued clicks, missing events and bursts of script execution that slow those actions.
The Limits
I would keep these limits in mind when deciding what the next optimization can achieve:
Loading controls do not rewrite an expensive algorithm. You may need an update, configuration change or replacement, or a developer may need to split work into smaller tasks. The same script can also take different amounts of time on different devices and page states.
A Lighthouse result varies with the test environment and the page’s state. The historical comparison here is a small set of homepage measurements, not a permanent rating of those sites. Keep enough repeated results to understand the variation.
TBT cannot supply a field INP value. You can obtain INP from sources such as PageSpeed Insights’ field section, Search Console, CrUX or your own real-user monitoring, subject to their coverage. Interaction recordings help investigate a problem before a rolling field report fully reflects a change.
A theme or builder can expose useful optimization controls, but a loading plugin cannot promise to fix every expensive component. I would measure the features your page actually uses before judging the whole product.
A score cannot tell you whether checkout, forms or consent still work. Test on staging, keep a rollback path and verify those actions before applying risky transformations to the live site.
What Quietly Ruins It
Delaying everything. A script can be critical even when it belongs to a third party. I would delay only the assets whose later execution is acceptable, with consent, dependencies and the first interaction tested.
Combining JavaScript without measuring. Bundling changes requests, caching and execution, but it does not automatically turn every original file into one long task. I would compare the resulting trace and caching behavior before keeping concatenation enabled.
Overlapping optimizers. Multiple tools changing the same scripts can create ordering and compatibility problems. I prefer one owner for each transformation; my Cloudflare setup for WordPress explains why I leave Rocket Loader off in that setup. Review integration settings when pairing GT Performance with another optimizer.
Trusting one result. Investigate an outlier before dismissing it or making changes around it. Differences in content, tags, caches and test conditions can all matter.
Optimizing only the score. Choose lab presets that reflect your audience and test actual interactions on relevant devices. Desktop and mobile results answer different questions; neither replaces the field picture.
Total Blocking Time Checklist
I would keep this checklist beside the report and work through one change at a time:
- Record several PageSpeed Insights results under the same preset, keeping the median and spread.
- Inspect long tasks and their attributed URLs, then check task timing in a matching trace.
- Decide whether each asset is needed here, can load later, needs a different loading strategy or requires a code change.
- Remove an unnecessary feature or unload its assets only on pages that do not need it.
- Review optional WordPress assets and dependencies before disabling them; test affected features.
- Test defer or minification separately, checking representative templates, interactions and errors.
- Delay only selected scripts after reviewing consent, dependencies and measurement requirements.
- Use a click-to-load preview for eligible embeds when that suits the visitor’s task.
- Investigate layout and style costs when they dominate; test any CSS reduction across responsive and interactive states.
- Repeat the lab tests and interaction checks, comparing the tasks, timings and variation.
- Monitor field INP and its coverage as the rolling data changes; use your own real-user monitoring for earlier feedback when available.
FAQs on Total Blocking Time
What is a good Total Blocking Time?
On the mobile Lighthouse scale, 0 to 200 ms is green, 200 to 600 ms is orange and over 600 ms is red. Desktop has different thresholds. Keep the test preset consistent, and check INP and real interactions as well as the lab result.
Does Total Blocking Time affect Google rankings?
TBT is a Lighthouse lab metric, not a Core Web Vital. Core Web Vitals contribute to Google’s page-experience signals, but a lab score is not a ranking guarantee. I would reduce blocking to improve the page and check real-user responsiveness through INP.
Why is my TBT high when my site loads fast?
A page can download quickly and still run expensive main-thread work. A 500 ms task contributes 450 ms of blocking when it falls wholly inside the measurement window. Inspect the task and its timing to choose between removing work, changing loading or improving the code.
Does caching reduce Total Blocking Time?
Caching can change delivery timing and the resulting test metric. It does not by itself remove an expensive JavaScript operation. Some cache plugins also optimize frontend code, so separate the effects of caching, minification, defer and delay when comparing results.
Is it safe to delay JavaScript in WordPress?
It depends on the script and the page. I would delay only selected assets after checking consent, dependencies, measurement requirements and the first interaction. Keep required navigation, forms and payment behavior available when users need it, and test the fallback timer too.
Why does TBT change between PageSpeed Insights runs?
Page content, third-party responses, cache state and the testing environment can vary. Compare several runs with the same configuration and keep the spread. A large outlier needs investigation; do not assume it is either a regression or harmless noise.
Why does a site with a red TBT still pass Core Web Vitals?
The lab measures one loading scenario, while field data summarizes actual visits and interactions over time. Different devices, page states, interactions and reporting scope can produce different results. A passing 75th-percentile INP still leaves room for some visitors to have slow interactions.
Does GT Performance fix Total Blocking Time on its own?
GT Performance provides selected-script delay, defer, local JavaScript minification, optional WordPress asset controls and other frontend features. Which settings help depends on the tasks your page runs. Per-page unloading may need a separate script manager, and expensive application logic can require a code change.
Final Remarks
I would start with one page and the task that most clearly needs attention. Make one change, check that the page still works and compare repeated results. Keep the change when the evidence supports it, then move to the next source of unnecessary work.
Tell Google you want more of this.
Add Gaurav Tiwari as a preferred sourceOne tap, and this site shows up more often in your own Top Stories, AI Overviews and AI Mode. Remove it any time.
Disclaimer: This site is reader-supported. If you buy through some links, I may earn a small commission at no extra cost to you. I only recommend tools I trust and would use myself. Your support helps keep gauravtiwari.org free and focused on real-world advice. Thanks. - Gaurav Tiwari