
 by
by

More people can read today than at any point in human history, and fewer of them choose to. Global adult literacy reached 88% in 2024. Over the same stretch, the share of Americans who read for pleasure on a given day fell from 28% in 2004 to 16% in 2023. Both numbers are accurate, and the tension between them is the story these reading statistics actually tell.
Most coverage picks a side. One camp treats every dip as proof that attention is dead and books are finished. The other waves it off, because the literacy headline keeps climbing and 75% of adults still finish a book each year. Both readings miss what the underlying data shows.
Reading is not shrinking evenly. It is sorting.
The people who still read are reading more than they did 20 years ago, not less. Everyone else moved to a feed. That split is the single most useful thing in this data, and it decides how long your articles should run, where the load-bearing sentence goes, which format earns attention, and why a slow page loses readers before a word registers.
Key Reading Statistics
Here are the figures that carry the rest of this page, each with the year it describes rather than the year someone published it.
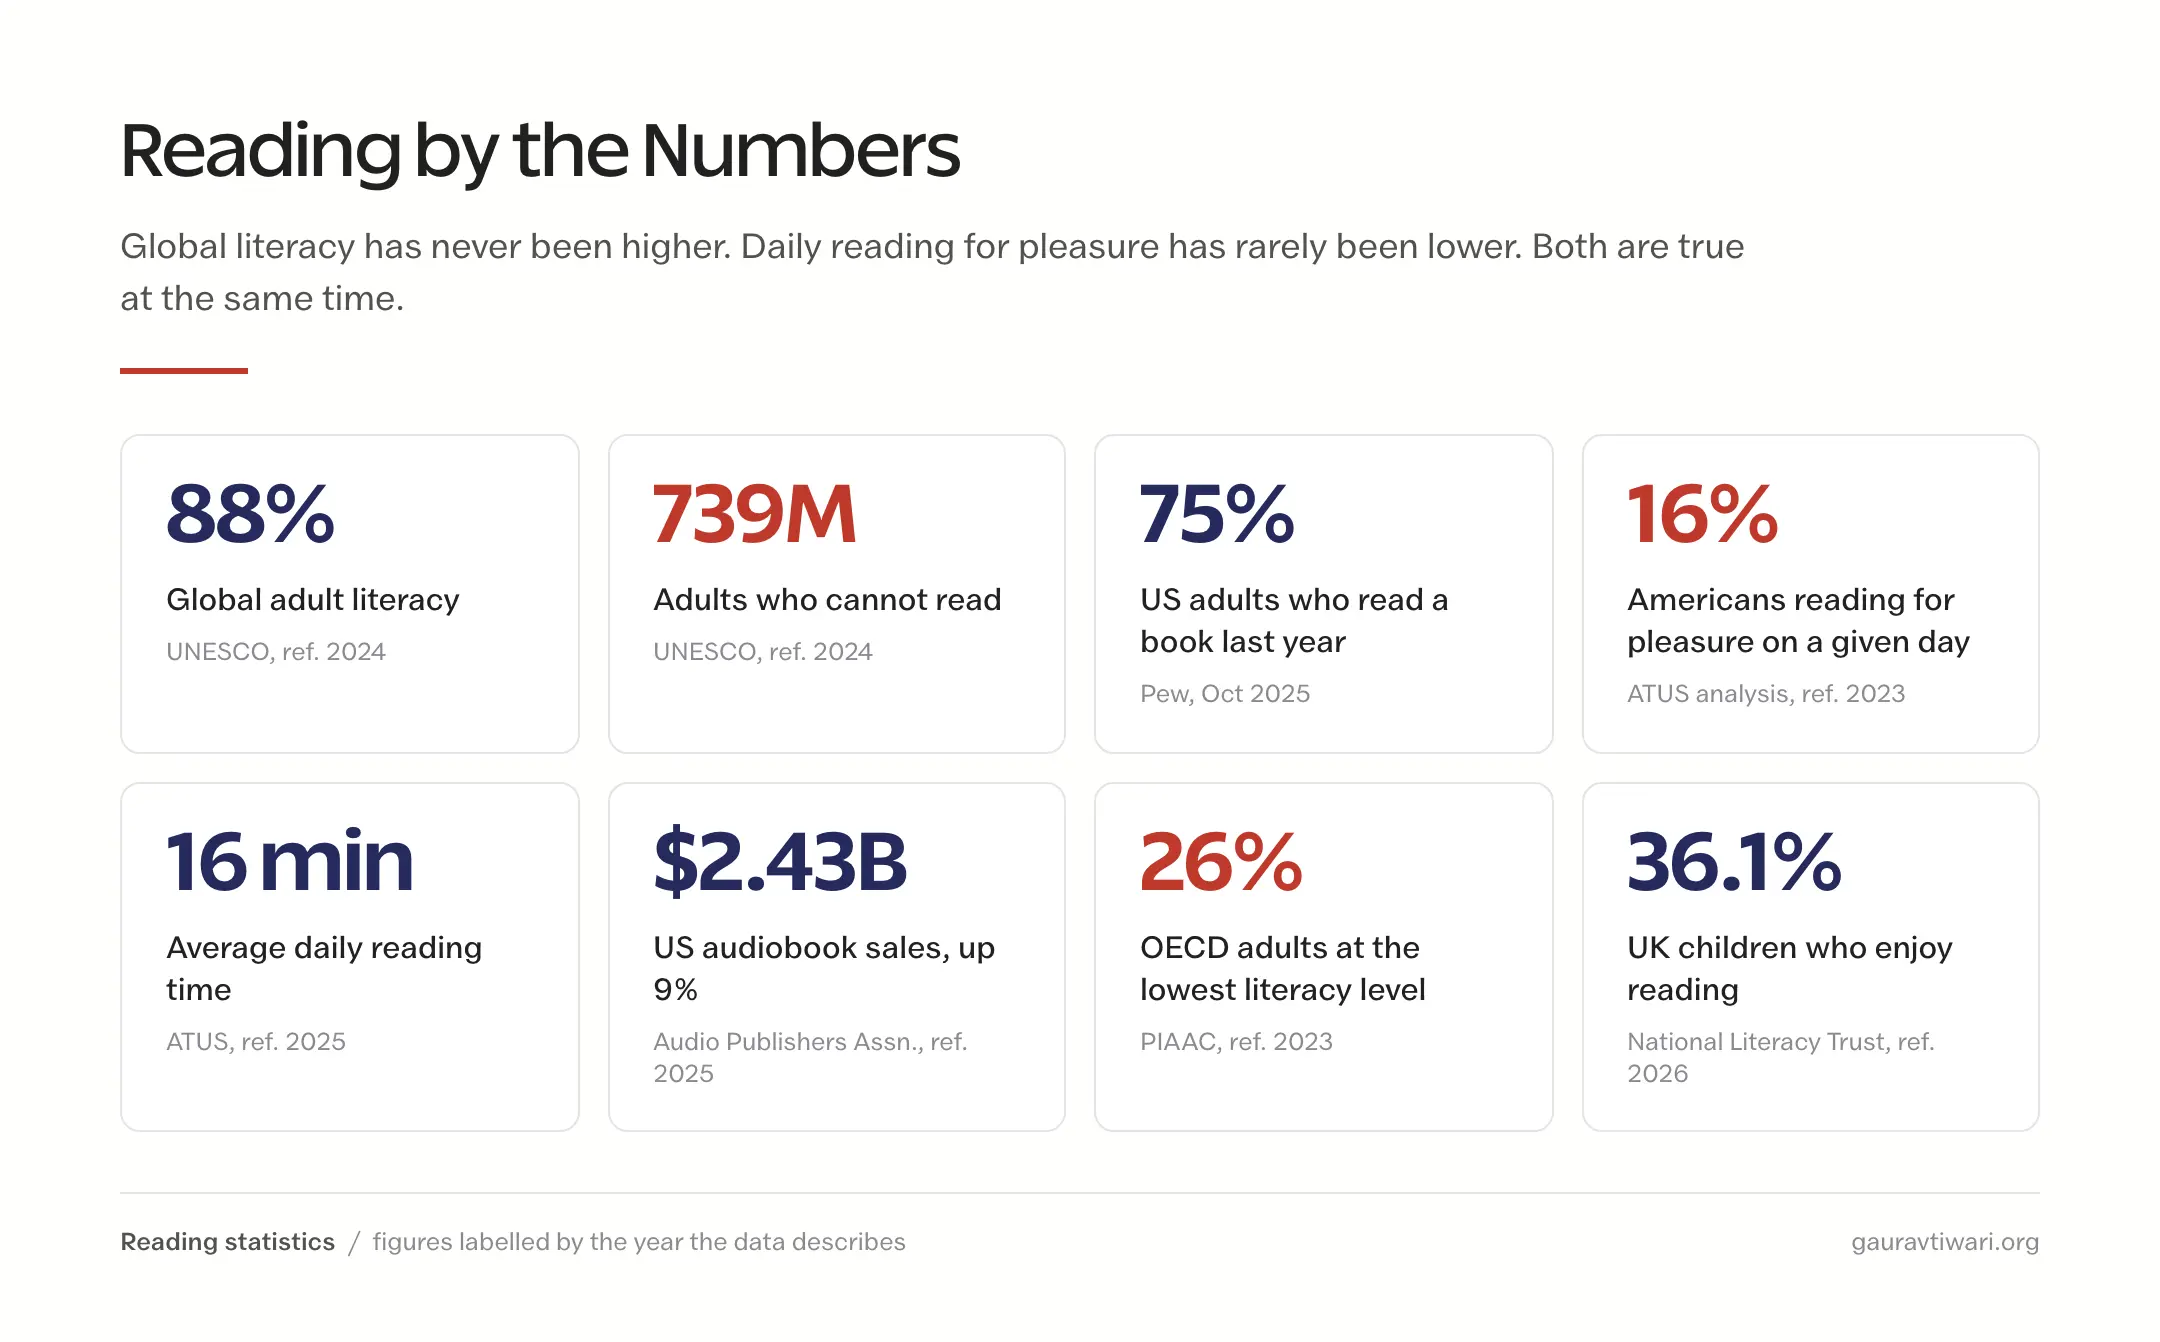
- 88% global adult literacy, the highest recorded (UNESCO, 2024)
- 739 million adults still cannot read, about two-thirds of them women (UNESCO, 2024)
- 75% of US adults read at least one book in the past year, flat since 2011 (Pew Research Center, October 2025)
- 64% print, 31% e-book, 26% audiobook among US book readers (Pew Research Center, October 2025)
- 16 minutes a day spent reading by the average American, against 2.6 hours of television (American Time Use Survey, 2025)
- 26% of adults across 31 developed economies score at the lowest literacy proficiency level or below (OECD PIAAC, 2023)
- 36.1% of UK children aged 8 to 18 enjoy reading in their free time, up from a 20-year low (National Literacy Trust, 2026)
- $2.43 billion in US audiobook sales, up 9% year on year (Audio Publishers Association, 2025)
Global Reading Statistics
The global adult literacy rate reached 88% in 2024, according to the UNESCO Institute for Statistics. Two centuries ago that figure was roughly 12%. Almost the entire flip happened inside four generations, which makes literacy one of the fastest large-scale changes in human behavior on record.
The gap that remains is still enormous. About 739 million adults could not read as of 2024, and close to two-thirds of them are women. Ten countries hold 441 million of that total, with India, Pakistan, Nigeria, China, and Ethiopia at the top.
One detail gets lost when that number is quoted as progress. The count fell from 754 million the year before, but UNESCO attributes most of the drop to a statistical revision rather than new readers: India’s measured literacy rate was revised upward from 77% to 81%. The world did not teach 15 million adults to read in 12 months. It counted them better.
Regional progress carries the same trap. Sub-Saharan Africa’s literacy rate climbed from 65% to 69% between 2015 and 2024, and over the same period the number of adults there who cannot read rose from 196 million to 225 million. Population growth outran the gains.
The rate improved. The problem got bigger.
Reading Hours by Country
The country-by-country comparison everyone cites comes from the NOP World Culture Score Index, and it deserves an honest label: it was published in July 2005, from fieldwork conducted between December 2004 and February 2005 across more than 30,000 respondents in 30 countries. The global average was 6.5 hours a week.
| Country | Reading hours per week | Against the global average |
|---|---|---|
| India | 10.7 hours | +4.2 |
| Thailand | 9.4 hours | +2.9 |
| China | 8.0 hours | +1.5 |
| France | 6.9 hours | +0.4 |
| United States | 5.7 hours | -0.8 |
| United Kingdom | 5.3 hours | -1.2 |
That last column matters, because the US figure is the one most often mangled in reproduction. You will see American reading time quoted at 7 hours a week on dozens of pages. The original release puts it at 5.7 and places the United States below the international average, which inverts the point people use the table to make.
Treat the whole table as a directional ranking from a specific moment, not a live scoreboard. No newer cross-country reading-time dataset exists to replace it. The OECD Time Use Database folds reading into a broader leisure aggregate, and the next wave of harmonised European time-use microdata is not expected before 2027. Every page presenting these figures as current is presenting 2005.
Time Spent Reading Each Day
For a number that actually updates every year, use the American Time Use Survey. Its 2025 data puts average reading at 16 minutes a day for Americans aged 15 and over, against roughly 2.6 hours of television.
- Adults aged 65 and over read 32 minutes a day
- Adults aged 15 to 24 read 10 minutes a day
- Women average 19 minutes, men 14 minutes
- 84% of Americans read for 5 minutes or less on a given day, while only 19% spend that little time on screens
That last pairing is the sharpest contrast in the whole dataset. The average American is not short on time for reading. The time goes somewhere else.
Adult Literacy Is Falling in Rich Countries
This is the finding that should have been bigger news than it was. The OECD’s Survey of Adult Skills, released in December 2024 after testing adults across 31 developed economies, found literacy proficiency had declined or stagnated almost everywhere since the previous cycle.
- Literacy improved in only 2 of 31 participating economies: Denmark and Finland
- 26% of adults across the OECD now score at Level 1 or below, the lowest proficiency band
- In the United States that share rose from 19% to 28%, roughly 58.9 million adults, with the average score falling from 268 to 262
- Hungary’s low-literacy share jumped from 18.6% to 32.5%
A Level 1 reader can find a single piece of information in a short, simple text. They struggle with anything requiring them to compare two sources, weigh a claim, or infer meaning that is not stated outright. Somewhere between a quarter and a third of adults in wealthy countries are now in that band.
You may have seen a different figure: that 54% of Americans read below a sixth-grade level. Skip it. It comes from a 2020 analysis of survey data collected between 2012 and 2017, and the survey’s own designers discourage converting their scale into grade equivalents. The measured 28% is both newer and defensible.
Reading Habits Among Students
Children’s reading enjoyment hit a 20-year low and then ticked back up. The National Literacy Trust found that in 2025 only 32.7% of children aged 8 to 18 enjoyed reading in their free time and 18.7% read something daily, the worst figures in two decades of the survey. In its 2026 data, drawn from 125,375 children across 479 schools, enjoyment recovered to 36.1% and daily reading to 20.3%.
The enjoyment rise is the first since 2021. Daily reading is the first rise since 2023. It is a rebound off a floor, not a recovery, and the floor is still 18.7 percentage points below where enjoyment sat in 2005.
The recovery also arrived unevenly. Enjoyment rose 4.3 points among children not receiving free school meals and 1.1 points among those who do, which more than doubled the gap between them from about 2 points to over 5.
Good news for some children is not the same as good news.
The Age Reading Falls Off
Three independent datasets, on two continents, using different methods, all locate the same cliff. Reading for pleasure collapses somewhere between ages 8 and 13, and it does not recover on its own.
- Scholastic finds the drop at age 9: children who say they love reading fall from 40% to 28%, and frequent readers from 57% to 35%
- The National Literacy Trust locates its steepest decline between ages 11 and 14
- NAEP shows 13-year-olds reading for fun almost every day falling from 35% in 1984 to 14% in 2025, and 9-year-olds from 53% to 37%
That NAEP figure is the one worth sitting with. Among American 13-year-olds, daily reading for pleasure has lost 60% of its share inside a single working lifetime.
Two things separate classrooms where this holds up from classrooms where it does not. Reading framed as a shared, social activity produces more voluntary reading than reading framed as homework with a worksheet attached. And print keeps winning for deep study, even among teenagers with strong digital skills, which is a preference worth respecting rather than arguing with.
Reading and Academic Performance
Students who read for fun score higher, and the honest version of that claim is more interesting than the tidy one. National Center for Education Statistics data on NAEP reading scores, grouped by how often students read for pleasure, shows the gap between frequent and infrequent readers widening as students get older.
| Age | Reads almost every day | Reads never or hardly ever | Gap |
|---|---|---|---|
| 9 | 226 | 208 | 18 points |
| 13 | 276 | 249 | 27 points |
| 17 | 302 | 272 | 30 points |
The widening is the finding. A gap that grows from 18 points to 30 points across eight years is what compounding looks like in practice: small differences in daily volume turning into large differences in capability, the same way small differences in a savings rate turn into large differences in a balance.
Reading frequency is not the biggest lever, though, and pretending otherwise does students a disservice. PIRLS 2021 measured both effects directly. Children who said they very much like reading scored 513 against 491 for those who said they do not, a 22-point gap. The gap between children from homes with many educational resources and homes with few was 542 against 456.
That is 86 points. Roughly 4 times the enjoyment effect.
So reading habits help, and they do not cancel out household circumstance. Anyone selling reading as a cure for educational inequality is overselling it. What the data supports is narrower and still worth acting on: for a given child, more reading produces better outcomes, and the advantage accumulates.
Pairing reading with retrieval multiplies the effect. The research behind active recall is consistent that testing yourself on material beats re-reading it, which is why strong students read and then close the book. Older students carrying heavy course loads sometimes lean on research paper writing services to keep up with output, but the analytical gains still come from doing the reading.
Digital Reading and Technology
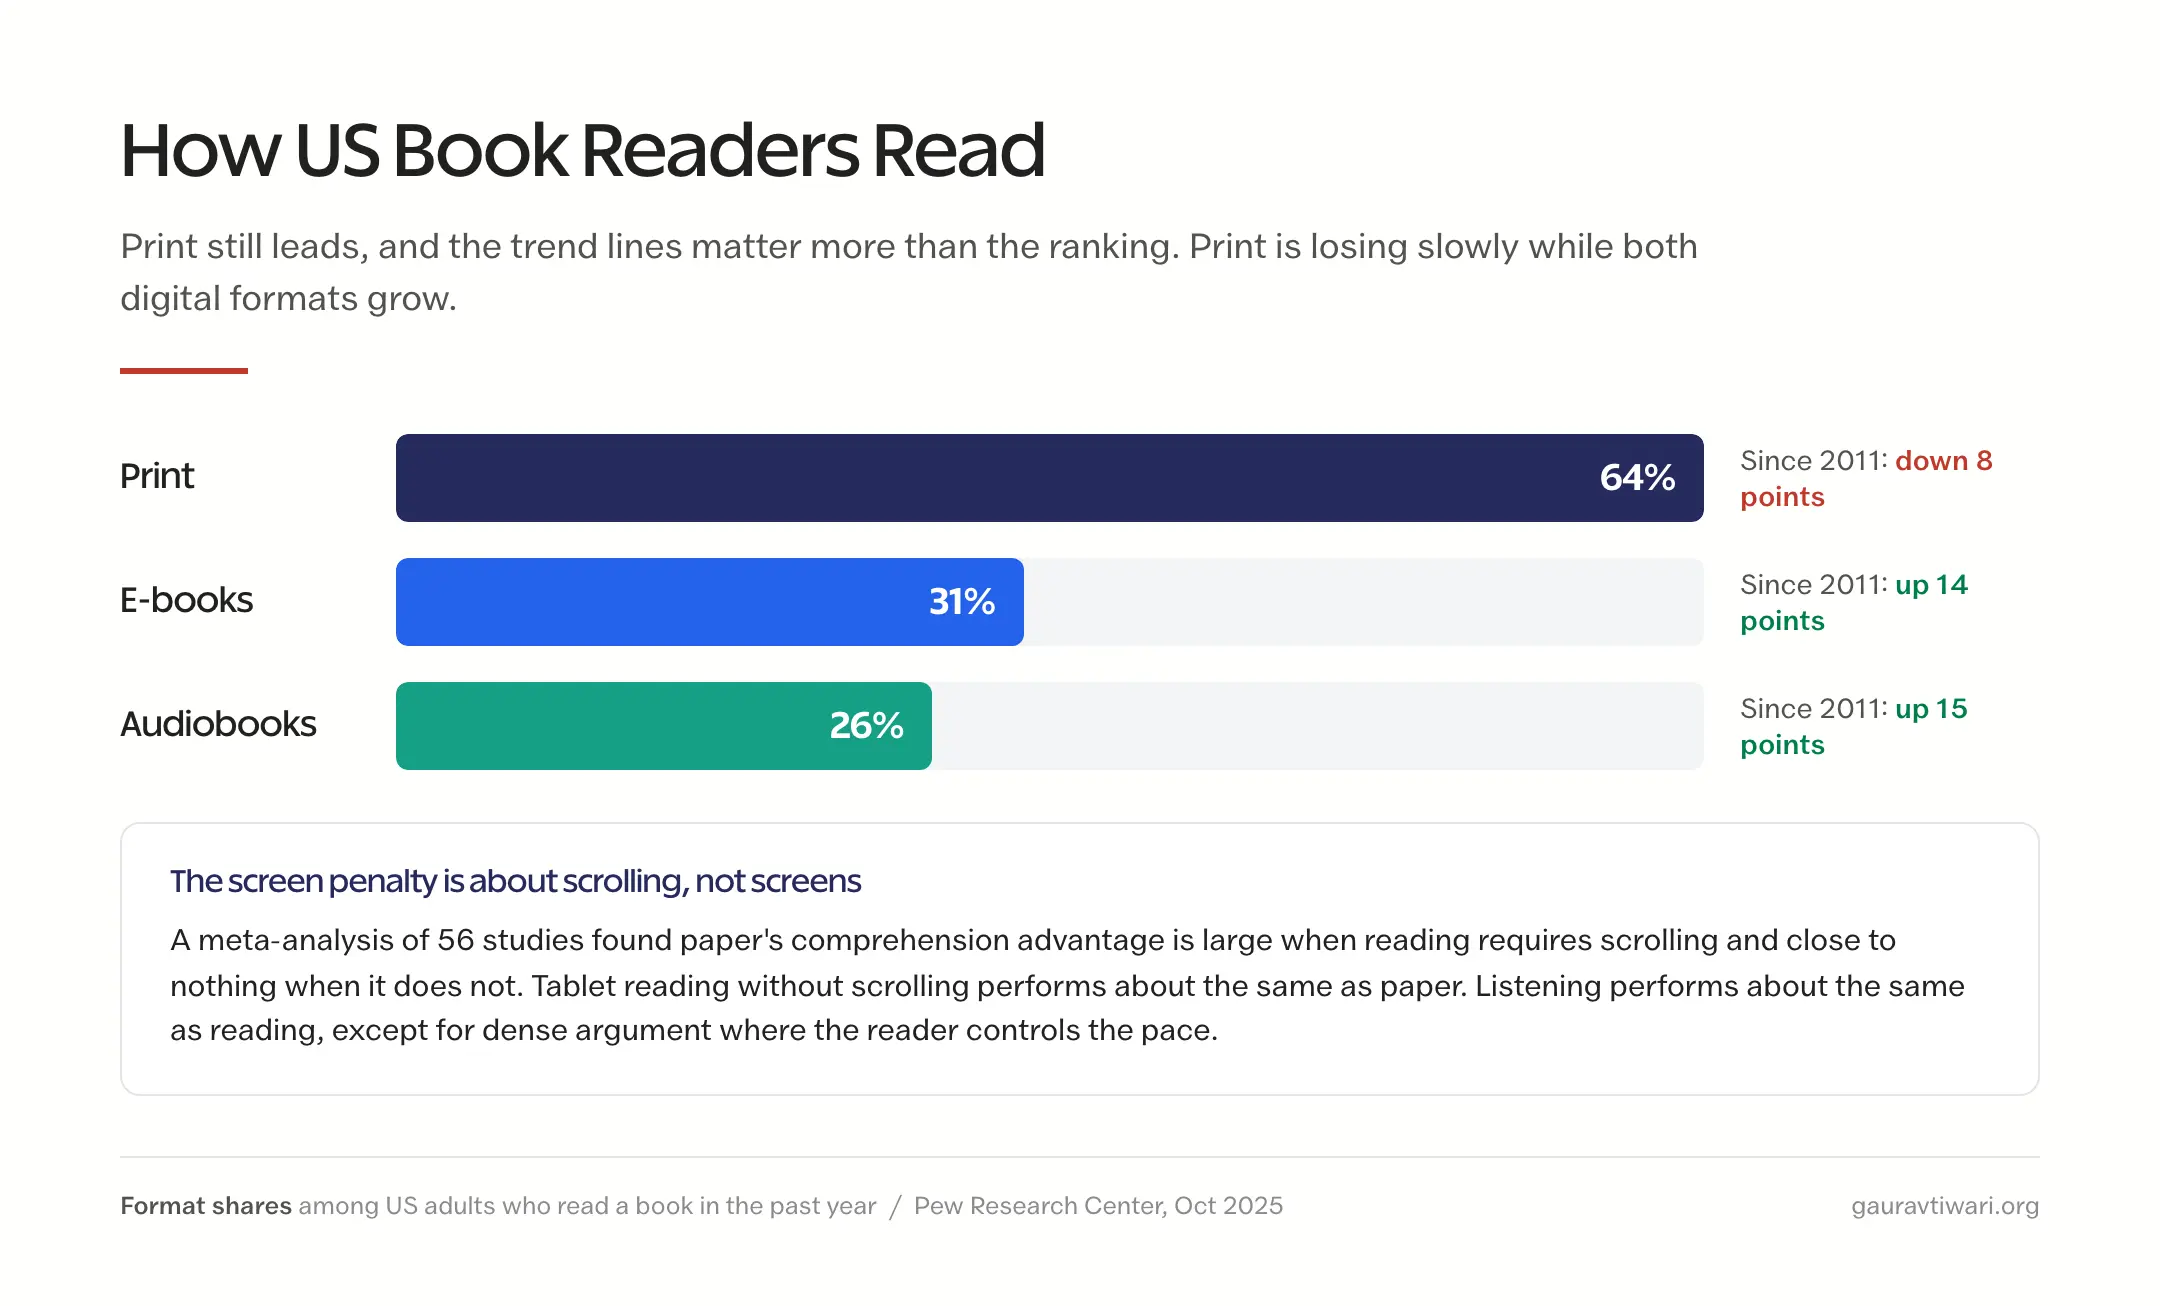
Technology changed the container, not the habit. Pew Research Center, surveying 8,046 US adults in October 2025, found 75% had read at least one book in the past year in some format. That share has barely moved since 2011.
Among book readers, print still leads by a wide margin.
- Print: 64%, down 8 points since 2011
- E-books: 31%, up 14 points
- Audiobooks: 26%, up 15 points
Read those trend lines rather than the ranking. Print leads because it is losing slowly, not because it is growing, and the two digital formats have taken almost all of the ground it gave up.
Reading for pleasure is where the real decline shows. The National Endowment for the Arts found 48.5% of US adults read a book for pleasure in 2022, down from 52.7% in 2017. People still read. Fewer choose to.
Print Versus Screen Comprehension
The popular version of this research says paper beats screens. The precise version says something more useful, and it changes what you should do about it.
A 2026 meta-analysis covering 56 studies found the paper advantage is large when reading requires scrolling and close to nothing when it does not. Reading on a tablet without scrolling performs about the same as reading on paper. The penalty tracks the interaction, not the material.
Earlier work points the same direction. The screen disadvantage concentrates in expository text, largely disappears for narrative, and worsens under time pressure. It is a comprehension effect, not a speed effect: readers are not measurably slower on screens, they retain less of what they read.
The screen is not the problem. Losing your place is.
Audiobooks come out better than most people expect. A 2022 review comparing listening against reading found no reliable overall difference in comprehension. Reading keeps a real edge in one specific place, inferential comprehension when the reader controls the pace, which is the case for dense argument rather than narrative.
For day-to-day digital reading, a dedicated e-reader beats a phone for a mechanical reason rather than a mystical one: nothing on it is competing for your attention. If you read enough to justify it, a subscription like Kindle Unlimited changes the cost per book.
Mobile Reading Statistics
Mobile devices account for about 52.6% of global web traffic as of July 2026, per StatCounter, with desktop at 45.9% and tablets making up the rest. That share has fallen over the past year, and the reason matters more than the number.
People did not put their phones down. AI crawlers and scrapers have grown fast enough to move the chart, and most of them are classified as desktop traffic. Read the decline as a measurement artifact, not a behavior change.
The behavioral gap between devices is wide and stable. Contentsquare’s benchmark, drawn from 99 billion sessions across more than 6,500 sites, puts it in numbers you can design against.
| Behavior | Desktop | Mobile |
|---|---|---|
| Average session length | 4 min 46 sec | 2 min 20 sec |
| Scroll rate | 50.5% | 45.2% |
| Bounce rate | 39.7% | 51.8% |
Engagement is also drifting down across the board. Year on year, that same benchmark records engagement off 10%, time on site off 7%, and scroll rate off 2%.
Page Speed and Reading
Speed decides whether reading happens at all, and the statistic everyone quotes for this is a decade old. The “53% of mobile visits are abandoned after 3 seconds” line comes from a Google study whose own footnote dates the underlying data to March 2016, collected in the 3G era. It is not a current benchmark.
Two better anchors exist. The first is an experiment rather than a correlation: across 30 million sessions and 37 brands, Deloitte and Google found a 0.1 second improvement in mobile load time produced 8.4% higher retail conversions and 9.2% higher average order value. Small improvement, disproportionate payoff.
The second is the standard Google actually measures you against now. Core Web Vitals covers Largest Contentful Paint at 2.5 seconds or less, Interaction to Next Paint at 200 milliseconds or less, and Cumulative Layout Shift at 0.1 or less. Interaction to Next Paint replaced First Input Delay in March 2024, so any guide still naming FID is out of date. Only about 48% of mobile origins pass all three.
Half the mobile web fails the bar. That is the opportunity.
In practice this means fast hosting, a responsive layout, a 16px minimum font size, generous line spacing, and compressed images so your own assets are not what pushes you past the threshold.
Attention Span and Content Consumption
The claim that human attention is now shorter than a goldfish’s is a myth with no research behind it. People have not lost the ability to focus. They have gotten ruthless about what earns it, which is a different problem with a different fix.
Here is what the measured research supports.
- Engaged time. Chartbeat’s global average sits at 26.5 seconds per page as of the first quarter of 2026
- The decision window. Nielsen Norman Group puts the highest abandonment risk in the first 10 seconds, still elevated through the next 20, and levelling off only around 30 seconds
- Reading speed. A meta-analysis of 190 studies covering 18,573 participants puts silent reading at 238 words per minute for non-fiction and 260 for fiction, with a normal range of 175 to 300
- Length. Chartbeat’s analysis of millions of articles finds engaged time keeps climbing with length up to around 4,000 words
Two of those deserve a second look, because they contradict advice you have probably been given.
The reading speed figure is lower than the familiar “300 words per minute average,” and that older number traces to research from the 1950s. In the modern meta-analysis, 300 words per minute is the top of the normal range rather than the middle of it. If you are sizing content around a 300 wpm reader, you are sizing it for an unusually fast one.
The length finding contradicts the popular 1,600 to 2,400 word sweet spot outright. There is no ceiling in that range. Longer articles hold attention longer, with the caveat that variance widens past 4,000 words, meaning long pieces succeed or fail harder than short ones. Length is not the variable. Whether the length is earned is.
The F-pattern deserves the same correction. Nielsen Norman Group’s own updated position is that F-shaped scanning is a failure state, what readers default to when a page gives them no strong cues about where to look. It is not a reading pattern to design for. It is a symptom of a page that did not help.
The fix is what they call layer-cake scanning: descriptive headings and lead sentences that let a reader move down the page in horizontal slices, taking the point of each section without reading every word. Structure for the scanner, and the reader who wants depth still gets it.
Reading the Summary Instead of the Source
This is the newest change in reading behavior and the one with the least coverage. A growing share of reading now stops at a machine-generated summary of something the reader never opens.
Pew Research Center measured it behaviorally rather than by asking people, tracking 68,879 real searches from 900 US adults in March 2025. The results are stark.
- Users clicked a search result on 8% of visits where an AI summary appeared, against 15% where none did
- Only 1% clicked a link inside the summary itself
- 26% ended their browsing session entirely after a page with a summary, against 16% without
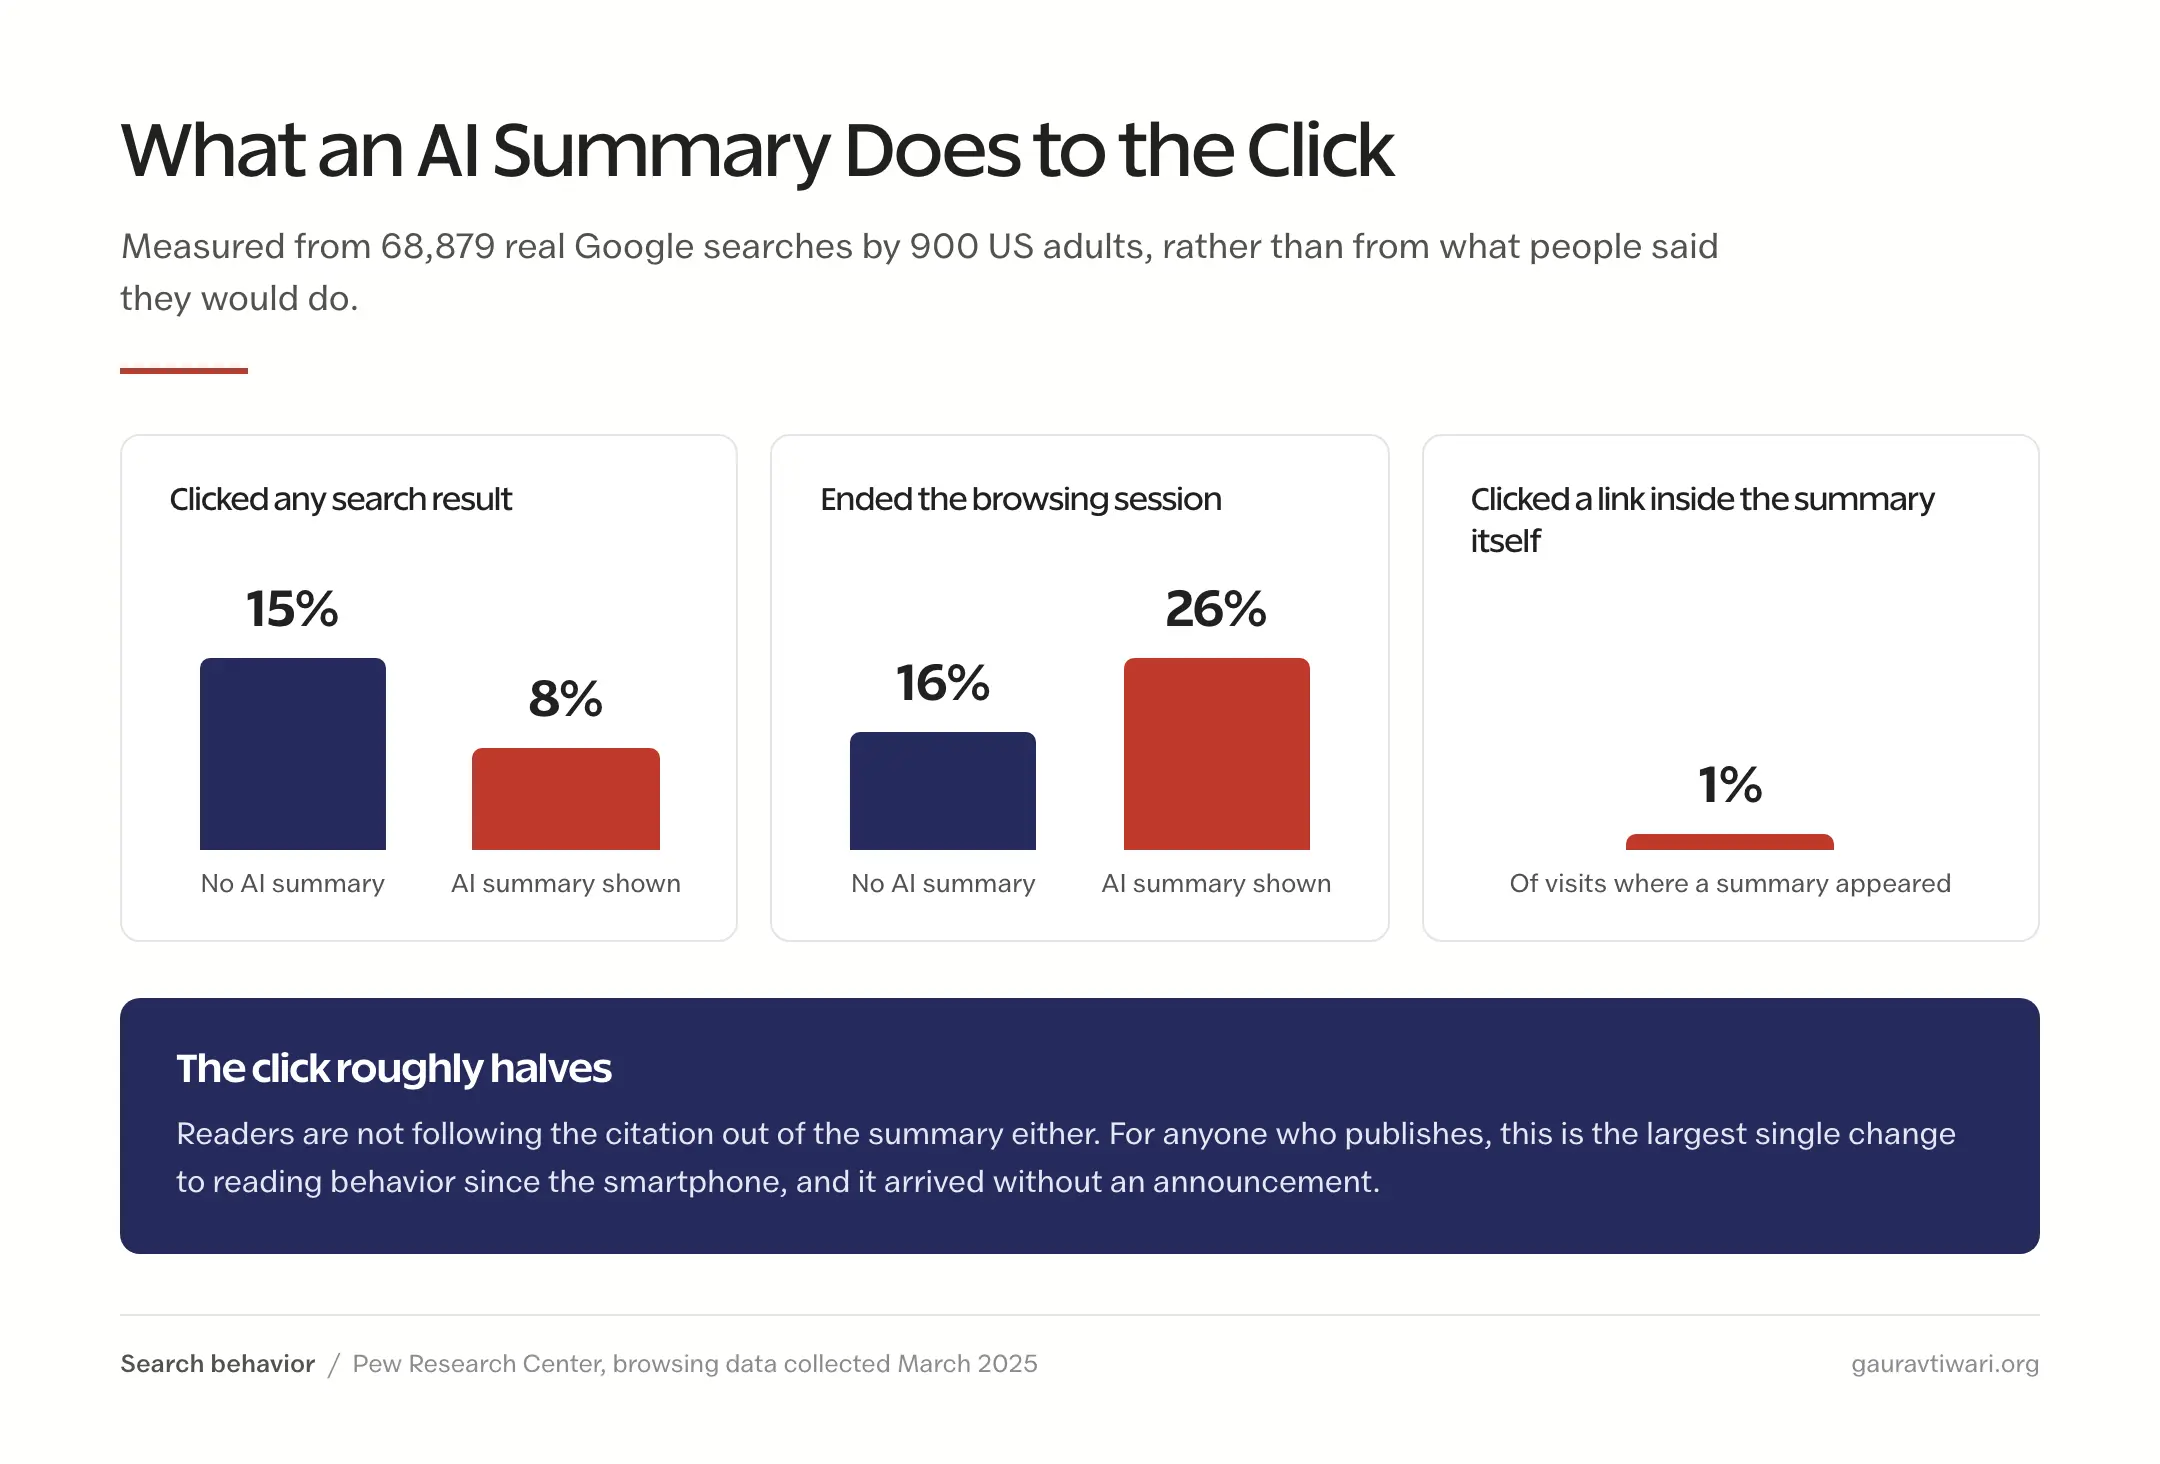
The click roughly halves. For anyone publishing, that is the headline reading statistic of the decade so far, and it arrived quietly.
What the summary does to the reader is the more interesting question. A study across 7 experiments with 10,462 participants gave people the same underlying facts, some through a search engine and some through a language model. The people who used the model spent less time on the task, 585 seconds against 743, and referenced fewer facts in the advice they then wrote, 0.464 against 0.718 per response. Their advice was also about 3 times more similar to each other’s.
Same information in. Shallower, more homogeneous understanding out.
Children have absorbed the habit faster than anyone. Ofcom’s 2026 survey of 3,426 UK children found 78% of 8 to 17 year olds at least sometimes read AI summaries when searching, and 46% of those believe the information is always accurate.
Two facts sit badly together there. Most children now read the summary, and nearly half of them do not think it needs checking.
What Is Actually Growing
Casual reading is falling and intentional reading is not. Sorting the two apart is what makes the rest of this data legible, and the growth side is bigger than the decline coverage suggests.
- Audiobooks: US sales reached $2.43 billion in 2025, up 9%, with 58% of Americans, roughly 157 million people, having listened to at least one (Audio Publishers Association)
- Library lending: 820.5 million digital checkouts in 2025, up 10%, with audiobook borrowing up 13% against ebooks up 3%
- Independent bookstores: 605 new US stores opened in 2025, an 87% increase over the previous year
- UK publishing: record revenue of GBP 7.4 billion in 2025
- Print: 762.4 million US units in 2025, up 0.3%, essentially flat
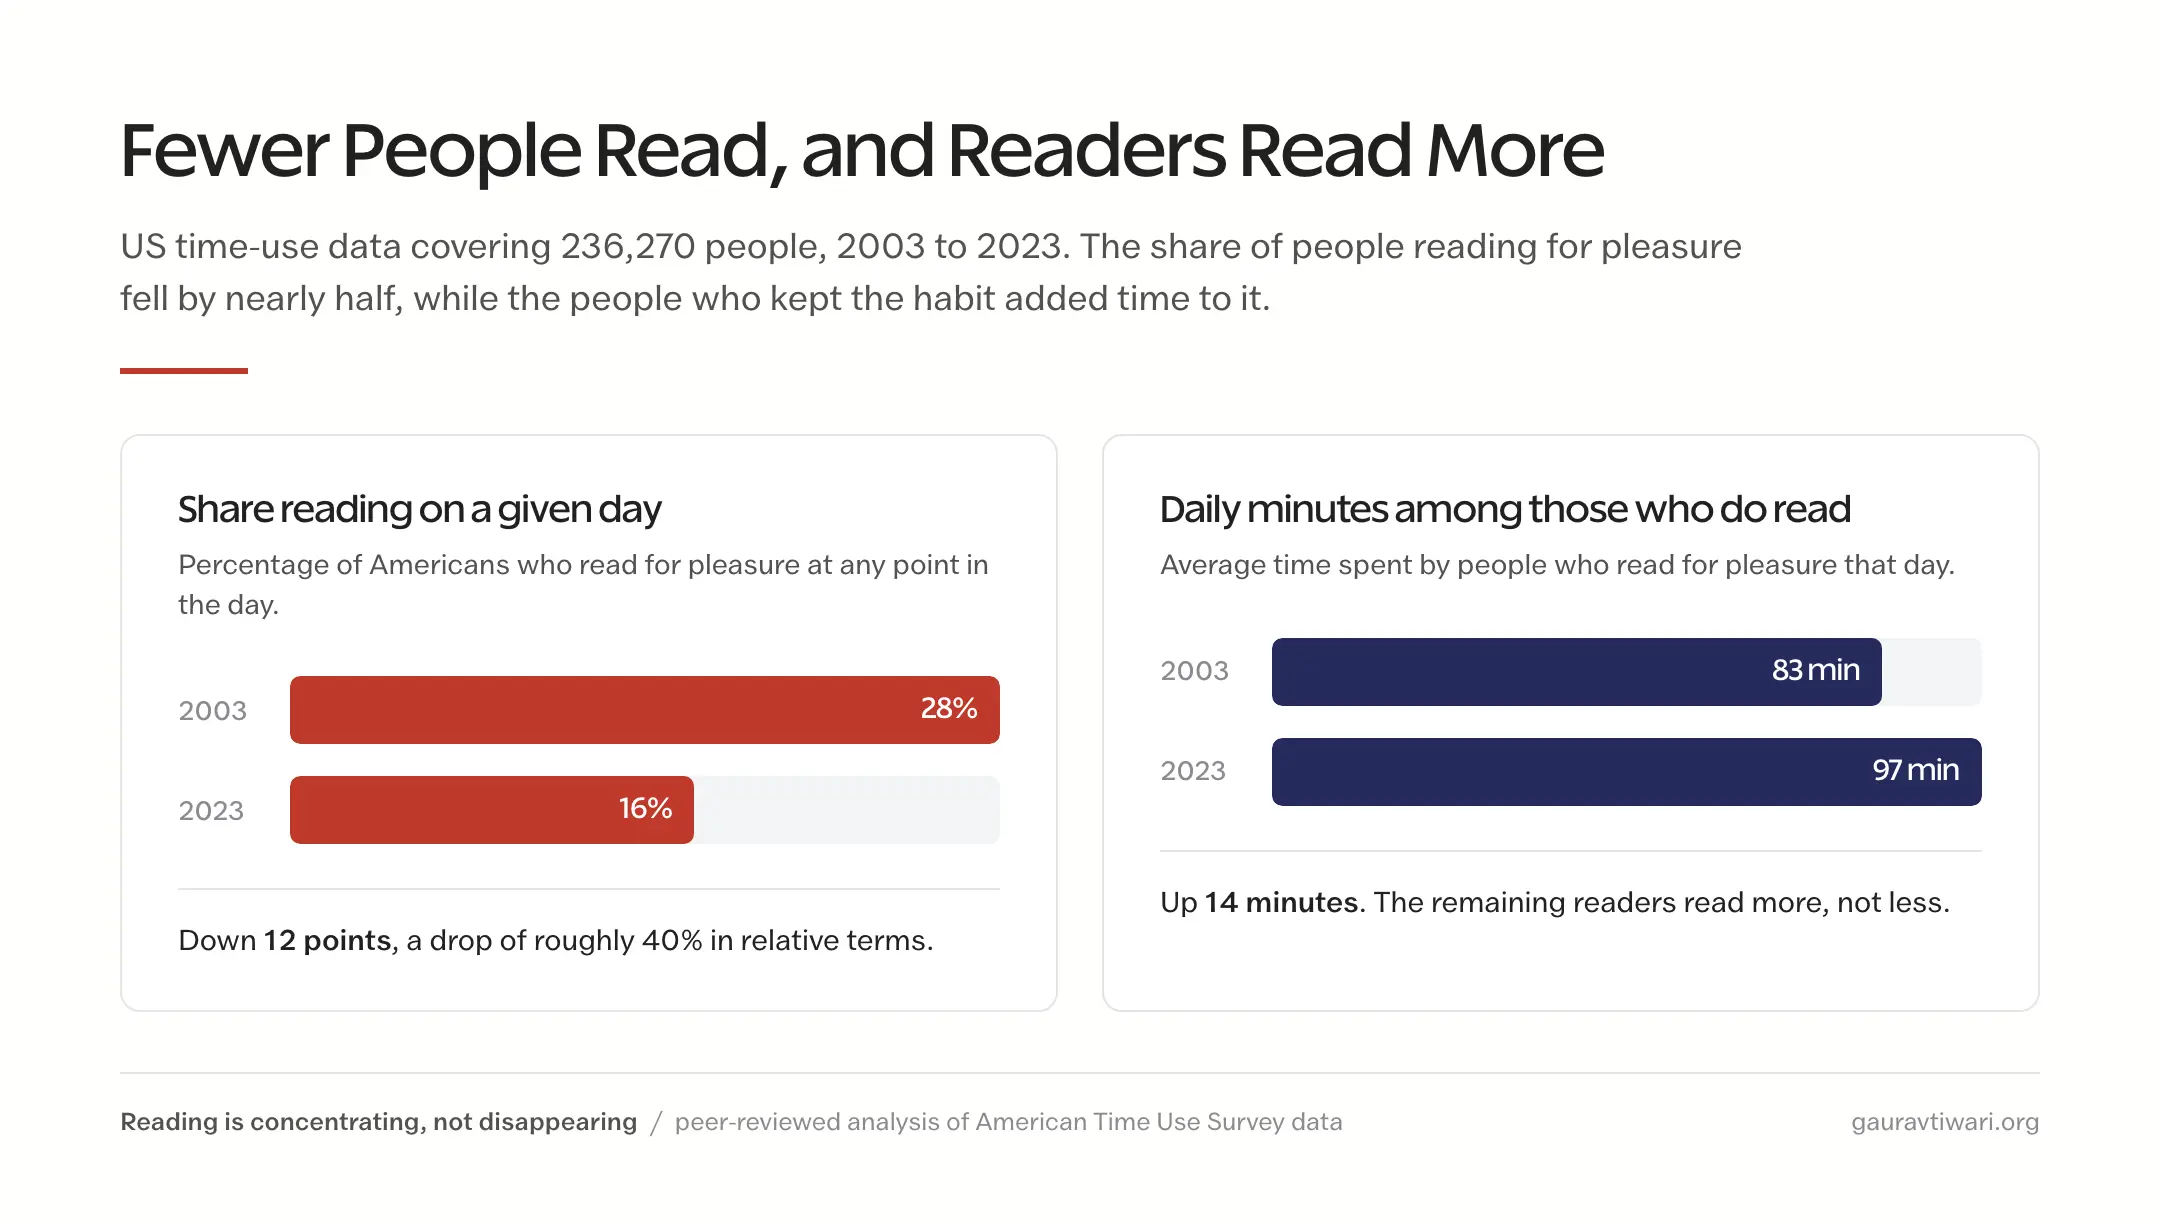
The peer-reviewed version of the sorting thesis arrived in August 2025. Analyzing 236,270 people in US time-use data between 2003 and 2023, researchers found the share reading for pleasure on a given day fell from 28% to 16%, while the average time spent by those who did read rose from 1 hour 23 minutes to 1 hour 37 minutes.
Fewer readers, reading more. That is not a dying habit, it is a concentrating one, and the same study found the concentration falls along familiar lines: people with postgraduate degrees were 2.79 times more likely to read on a given day.
One growth story is worth deflating. AI-narrated audiobooks get written about as if they are taking over, and they account for about 0.03% of audiobook revenue. Only 16% of listeners have tried one, and willingness to try fell from 70% to 61% in a single year even as Audible shipped more than 40,000 synthetically narrated titles. Supply is racing ahead of demand.
If you publish, the practical read is simple: ship audio versions of your best work. Audible and the library apps have built an audience of people who absorb 20 or more books a year without ever calling themselves readers.
How India Reads Now
India leads every country reading-time comparison and rarely gets more than a row in a table. Its literacy trajectory is one of the larger stories in this data.
- National literacy rose from 74% in 2011 to 80.9% in 2023-24
- Jammu and Kashmir became the 10th fully literate state or union territory in August 2026, after 99.09% of identified non-literates passed assessment
- 23.4% of rural Class 3 children can read a Class 2 text, the highest figure in the annual survey’s history
That last number cuts both ways, and it should. A record high still means more than three quarters of rural Class 3 children cannot read a text two grades below their own. Progress and crisis are describing the same classroom.
The digital picture is more encouraging. India now has roughly 958 million internet users, and 98% of them access content in an Indic language, which has pulled regional-language publishing and audio into a growth market that English-first coverage tends to miss.
What Reading Actually Does to You
The numbers that stick with me are not about who reads. They are about what happens to the people who keep the habit, and this is the area where popular reading statistics are least reliable, so each of these comes with its evidence quality attached.
Readers live longer, in a correlational study. Yale School of Public Health researchers followed 3,635 adults over 50 for up to 12 years and found book readers had a 20% lower risk of dying during the study, with those reading more than 3.5 hours a week at 23% lower risk. The survival advantage was just under 2 years before adjustment. Reading was self-reported once, in 2001, and the design cannot separate reading from whatever else distinguishes people who read.
Reading tracks cognitive ability strongly in adolescence. A 2025 study of 8,125 adolescents with brain imaging found each additional hour of daily reading associated with a gain of 2.45 points in crystallized cognition, an effect the authors describe as similar in size to established contributions of parental income and education.
There appears to be an optimum, not a maximum. Work using a sample of 10,243 people put the cognitive benefit peak at around 12 hours of pleasure reading a week, with a causal signal from genetic instrumental analysis rather than correlation alone. That is one of the few places in this literature where causation is even arguable.
Reading before bed improves sleep, in an actual trial. A randomized controlled trial with 991 participants found that reading in bed for a week improved sleep quality for 42% of the reading group against 28% of the control group.
The vocabulary claim is real but smaller than advertised. The famous figure that 20 minutes of daily reading exposes a child to 1.8 million words a year traces to a 1988 study of 155 fifth-graders keeping activity diaries. That number describes the 90th-percentile child. The median child in the same study read 4.6 minutes a day and met about 282,000 words, and the authors warned their own estimates were unstable.
The fiction and empathy link is weaker than you have been told. The 2013 study that launched it failed to replicate. The original authors’ own preregistered attempts produced two failures and one success, and a 2022 analysis of the whole literature found its statistical evidence hinges on a single result. The correlation between lifetime fiction reading and social reasoning does hold. The claim that reading fiction causes empathy does not, yet.
None of this is magic. It is the accumulated return on a habit that demands sustained attention in an environment engineered to fragment it, which is also why protecting your own reading time is one of the cheapest high-return decisions available.
Reading Statistics That Are Not True
Reading statistics have an unusually bad zombie problem. A handful of numbers get repeated across thousands of pages, and several of them trace back to nothing. These are the ones you will meet most often.
Six minutes of reading reduces stress by 68%. There is no paper. The claim comes from a 2009 press release for a chocolate brand’s book giveaway, produced by a private neuromarketing consultancy that rented space at a university innovation centre. No methods, no sample size, nothing in any research database. It is quoted as a University of Sussex study because of the address.
Human attention spans are now shorter than a goldfish’s. No study ever established either half of that comparison. It circulated through a corporate slide deck and never left.
53% of mobile visits are abandoned after 3 seconds. Real study, obsolete data. The footnote dates it to March 2016 and mobile networks were slower by a wide margin.
The average web page holds attention for 52 seconds. Attributed to Chartbeat almost everywhere. Chartbeat never published it, and its actual measured figure is roughly half that.
54% of American adults read below a sixth-grade level. Built by converting a 2012 to 2017 skills survey into grade levels, which the survey’s designers advise against.
The pattern is worth learning, because it repeats outside this topic. A number gets published once with a date and a method, then gets quoted without them, then gets quoted from the quote. By the fourth hop nobody can say what was measured or when. Check the footnote before you repeat the figure.
How to Actually Read More
Most people do not need motivation to read more. They need less friction. The data is consistent that structured, intentional reading is the part that keeps growing, so build a small system rather than relying on willpower.
Shrink the goal. Ten pages a day beats a vague plan to read more, and it compounds to roughly a dozen books a year.
Make the book the easy option. Keep one on your phone, one by the bed, and one on a Kindle, so something is always within reach.
Use audio for dead time. Commutes, chores, and walks add up fast, and 30 minutes a day is about a book a month.
Join a challenge or a club. Social accountability is the mechanism behind the one part of reading that is growing while casual reading falls.
Track it. A streak or a list works the same way a fitness app does.
If you want to nudge someone else into the habit, my gift ideas for book lovers is a better starting point than another recommendation list, and my own books are there if the topics fit.
The Limits of This Data
Reading statistics are softer than they look, and the honest caveats change how much weight each number can carry.
- Almost everything here is self-reported. People overstate reading and understate screen time, consistently and in the same direction, so treat absolute levels as softer than the trends
- The country table is from 2005 and no modern replacement exists. It ranks, it does not measure today
- Literacy counts move on revisions. A country recalculating its own rate can shift the global figure more than a year of actual progress
- Nearly all the health findings are correlational. People who read differ from people who do not in income, education, and health before any reading happens
- Web engagement benchmarks are survivorship-shaped. They are drawn from sites already instrumented for analytics, which skews toward larger and better-run properties
None of that makes the picture unusable. It means the direction of each trend is far more trustworthy than any single decimal place, and anyone quoting these figures to two decimals is overselling the instrument.
Frequently Asked Questions
How many people read books regularly?
Pew Research Center found 75% of US adults read at least one book in the past year in some format, surveying 8,046 adults in October 2025. That share has been stable since 2011. Reading specifically for pleasure is lower, at 48.5% per the National Endowment for the Arts.
What is the global literacy rate?
The global adult literacy rate reached 88% in 2024, per the UNESCO Institute for Statistics. About 739 million adults still could not read, close to two-thirds of them women. Two centuries ago the rate was roughly 12%, which makes literacy one of the fastest large-scale behavioral changes on record.
Which country reads the most?
By the NOP World Culture Score Index, India leads at 10.7 hours per person per week, then Thailand at 9.4 and China at 8.0. France sits at 6.9, the United States at 5.7, and the United Kingdom at 5.3. The index was published in 2005 and no newer cross-country study has replaced it.
How much time does the average person spend reading?
Americans aged 15 and over read 16 minutes a day, against about 2.6 hours of television, per the 2025 American Time Use Survey. Adults 65 and over read 32 minutes daily while 15 to 24 year olds read 10. Among Americans who do read for pleasure, the daily average is over 1.5 hours.
Is reading declining?
Casual reading is declining and committed reading is not. US time-use data covering 236,270 people shows the share reading for pleasure on a given day fell from 28% in 2004 to 16% in 2023, while those who still read went from 1 hour 23 minutes to 1 hour 37 minutes daily. Fewer readers, reading more.
What is the average adult reading speed?
A meta-analysis of 190 studies covering 18,573 participants puts silent reading at 238 words per minute for non-fiction and 260 for fiction, with a normal range of 175 to 300. The familiar 300 words per minute figure comes from 1950s research and sits at the top of the modern range, not the middle.
Do students prefer digital or print books?
Students use digital for convenience and prefer print for focused study. A 2026 meta-analysis of 56 studies found the paper advantage is large only when reading requires scrolling and close to nothing when it does not. Tablet reading without scrolling performs about the same as paper, so the interaction matters more than the medium.
Does reading improve academic performance?
Yes, and the gap widens with age. NAEP reading scores by reading frequency show an 18-point gap at age 9, 27 points at 13, and 30 points at 17. Household resources matter more, though: PIRLS 2021 measured an 86-point socio-economic gap against a 22-point reading-enjoyment gap.
Final Remarks
The story in this data is not that people stopped reading. It is that reading stopped being the default thing you do when you are bored, and became something you choose on purpose. The people who make that choice are reading more than their equivalents did 20 years ago. Everyone else has something faster in their pocket.
That reframe matters because it changes the fix. If attention were dying, the answer would be shorter everything. It is not dying, it is being spent more selectively, and the honest trade is that anything worth reading now has to earn its length in the first 10 seconds and keep earning it. Nothing gets the benefit of the doubt anymore, including this page.
The habit is under pressure, not in retreat. Decide which side of that split you are publishing for.
Tell Google you want more of this.
Add Gaurav Tiwari as a preferred sourceOne tap, and this site shows up more often in your own Top Stories, AI Overviews and AI Mode. Remove it any time.
Disclaimer: This site is reader-supported. If you buy through some links, I may earn a small commission at no extra cost to you. I only recommend tools I trust and would use myself. Your support helps keep gauravtiwari.org free and focused on real-world advice. Thanks. - Gaurav Tiwari