
 by
by
Americans filed about 5.6 million business applications in 2025, the most on record, and roughly 1 in 19 of those becomes an employer business within a year. Both numbers are true. Which one you quote decides whether the headline reads as a boom or a funnel, and most business statistics pages only quote the first.
The same split runs through the whole topic. One camp repeats that 90% of startups fail, a figure with no study behind it. The other treats every record formation month as proof that starting a business has never been easier. The measured picture is less dramatic than either: about half of new businesses are still open after 5 years, a third after 10, and those rates have barely moved in a decade.
The failure rate is not the interesting number. The conversion rate is.
Every figure below names the organization that measured it and the year the data describes, because in this field the gap between “published” and “measured” is often 3 to 5 years, and the most quoted numbers are the ones nobody has re-checked.
Key Business Statistics
These carry the rest of the page.
- 36.2 million small businesses in the US, 99.9% of all firms, employing 62.3 million people (SBA Office of Advocacy, data year 2022, published February 2026)
- 77.9% of new establishments survive their first year, 51.4% reach year 5, and 34.7% reach year 10 (Bureau of Labor Statistics, cohorts measured March 2025)
- 70% of failed VC-backed startups ran out of capital, the top reason by a wide margin (CB Insights, 431 companies that shut down since 2023, published March 2026)
- $440 billion in global venture funding in 2025, then $510 billion in the first half of 2026 alone (Crunchbase)
- 7.6% of US businesses used AI in the year to August 2025, against 88% of large enterprises in McKinsey’s survey. Same question, different universe (Census Bureau; McKinsey)
- 9.74% net margin and 37.76% gross margin across 5,994 US firms (NYU Stern, Damodaran, January 2026)
- 16.4% of US retail sales happened online in 2025, not the 20%-plus figure that circulates (Census Bureau)
- 59% of US billion-dollar startups have an immigrant founder (National Foundation for American Policy, June 2026)
Small Business Statistics
The SBA Office of Advocacy counts 36.2 million small businesses in the United States, and the split inside that number matters more than the total. Most of them have no employees at all.
- 29.8 million are nonemployer firms, 82.3% of the total, meaning solo operations with no payroll
- 6.4 million are employer firms, 17.7%
- Small businesses employ 62.3 million people, 45.9% of the private-sector workforce, and pay 38.7% of private payroll, about $3.5 trillion
- They produce 43.5% of GDP
- Between January 1995 and December 2024, small businesses created 20.7 million net new jobs against 13.2 million for large firms, 61% of the total
- Federal paperwork cost small businesses more than $81 billion in 2025, over 80% of it from the IRS alone
That 82% nonemployer share is the number that reframes every other statistic about “small business.” When a survey says the average small business earns $58,000 a year, it is mostly describing one person with a side income, not a shop with a payroll. The two populations behave so differently that any figure not split between them is close to useless.
Worldwide, the World Bank puts small and medium enterprises at roughly 90% of all businesses and more than half of employment. The European Commission’s figure for the EU is 99% of firms.
New Business Formation
Business applications have been running above the 2021 pandemic peak through 2026, and the Census Bureau’s Business Formation Statistics give the cleanest monthly view.
- About 5.6 million applications in 2025, up 6.5% on 2024 and roughly 60% above the pre-pandemic average of 3.5 million
- 578,926 applications in July 2026, seasonally adjusted, up 8.1% on June
- Of those July filings, Census projects 29,959 will become employer businesses within 4 quarters, a 5.2% conversion rate
- On the establishment side, about 1.3 million opened and 1.2 million closed permanently in 2023 (SBA, from BLS data)
An application is an Employer Identification Number filing, not a business. Some are side projects, some are tax structures, many never trade. So “5.6 million new businesses” overstates what happened by something like 19 times if you mean businesses with payroll, and by about 4 times even if you count every establishment birth.
Applications measure intent. Establishments measure follow-through.
The pattern repeats outside the US. India’s Udyam portal has registered 52.6 million MSMEs as of August 2026. The UK incorporates about 770,000 new companies a year on the current Companies House run rate, 192,287 of them in the second quarter of 2026. Both are registration counts, and neither says how many are trading.
Startup Survival Statistics
About half of new businesses are still operating 5 years in, and that has been true for every cohort the Bureau of Labor Statistics has tracked since the 1990s. The survival curve is one of the most stable numbers in economics, which makes it strange that it is also one of the most misquoted.
BLS measures survival by birth cohort, so each figure below describes a different group of establishments, all measured as of March 2025.
- 77.9% survived their first year (opened in the year to March 2024)
- 51.4% survived 5 years (opened in the year to March 2020)
- 34.7% survived 10 years (opened in the year to March 2015)
- The 1994 cohort, the longest on record, shows 20.3% alive at 20 years and 12.6% at 31 years
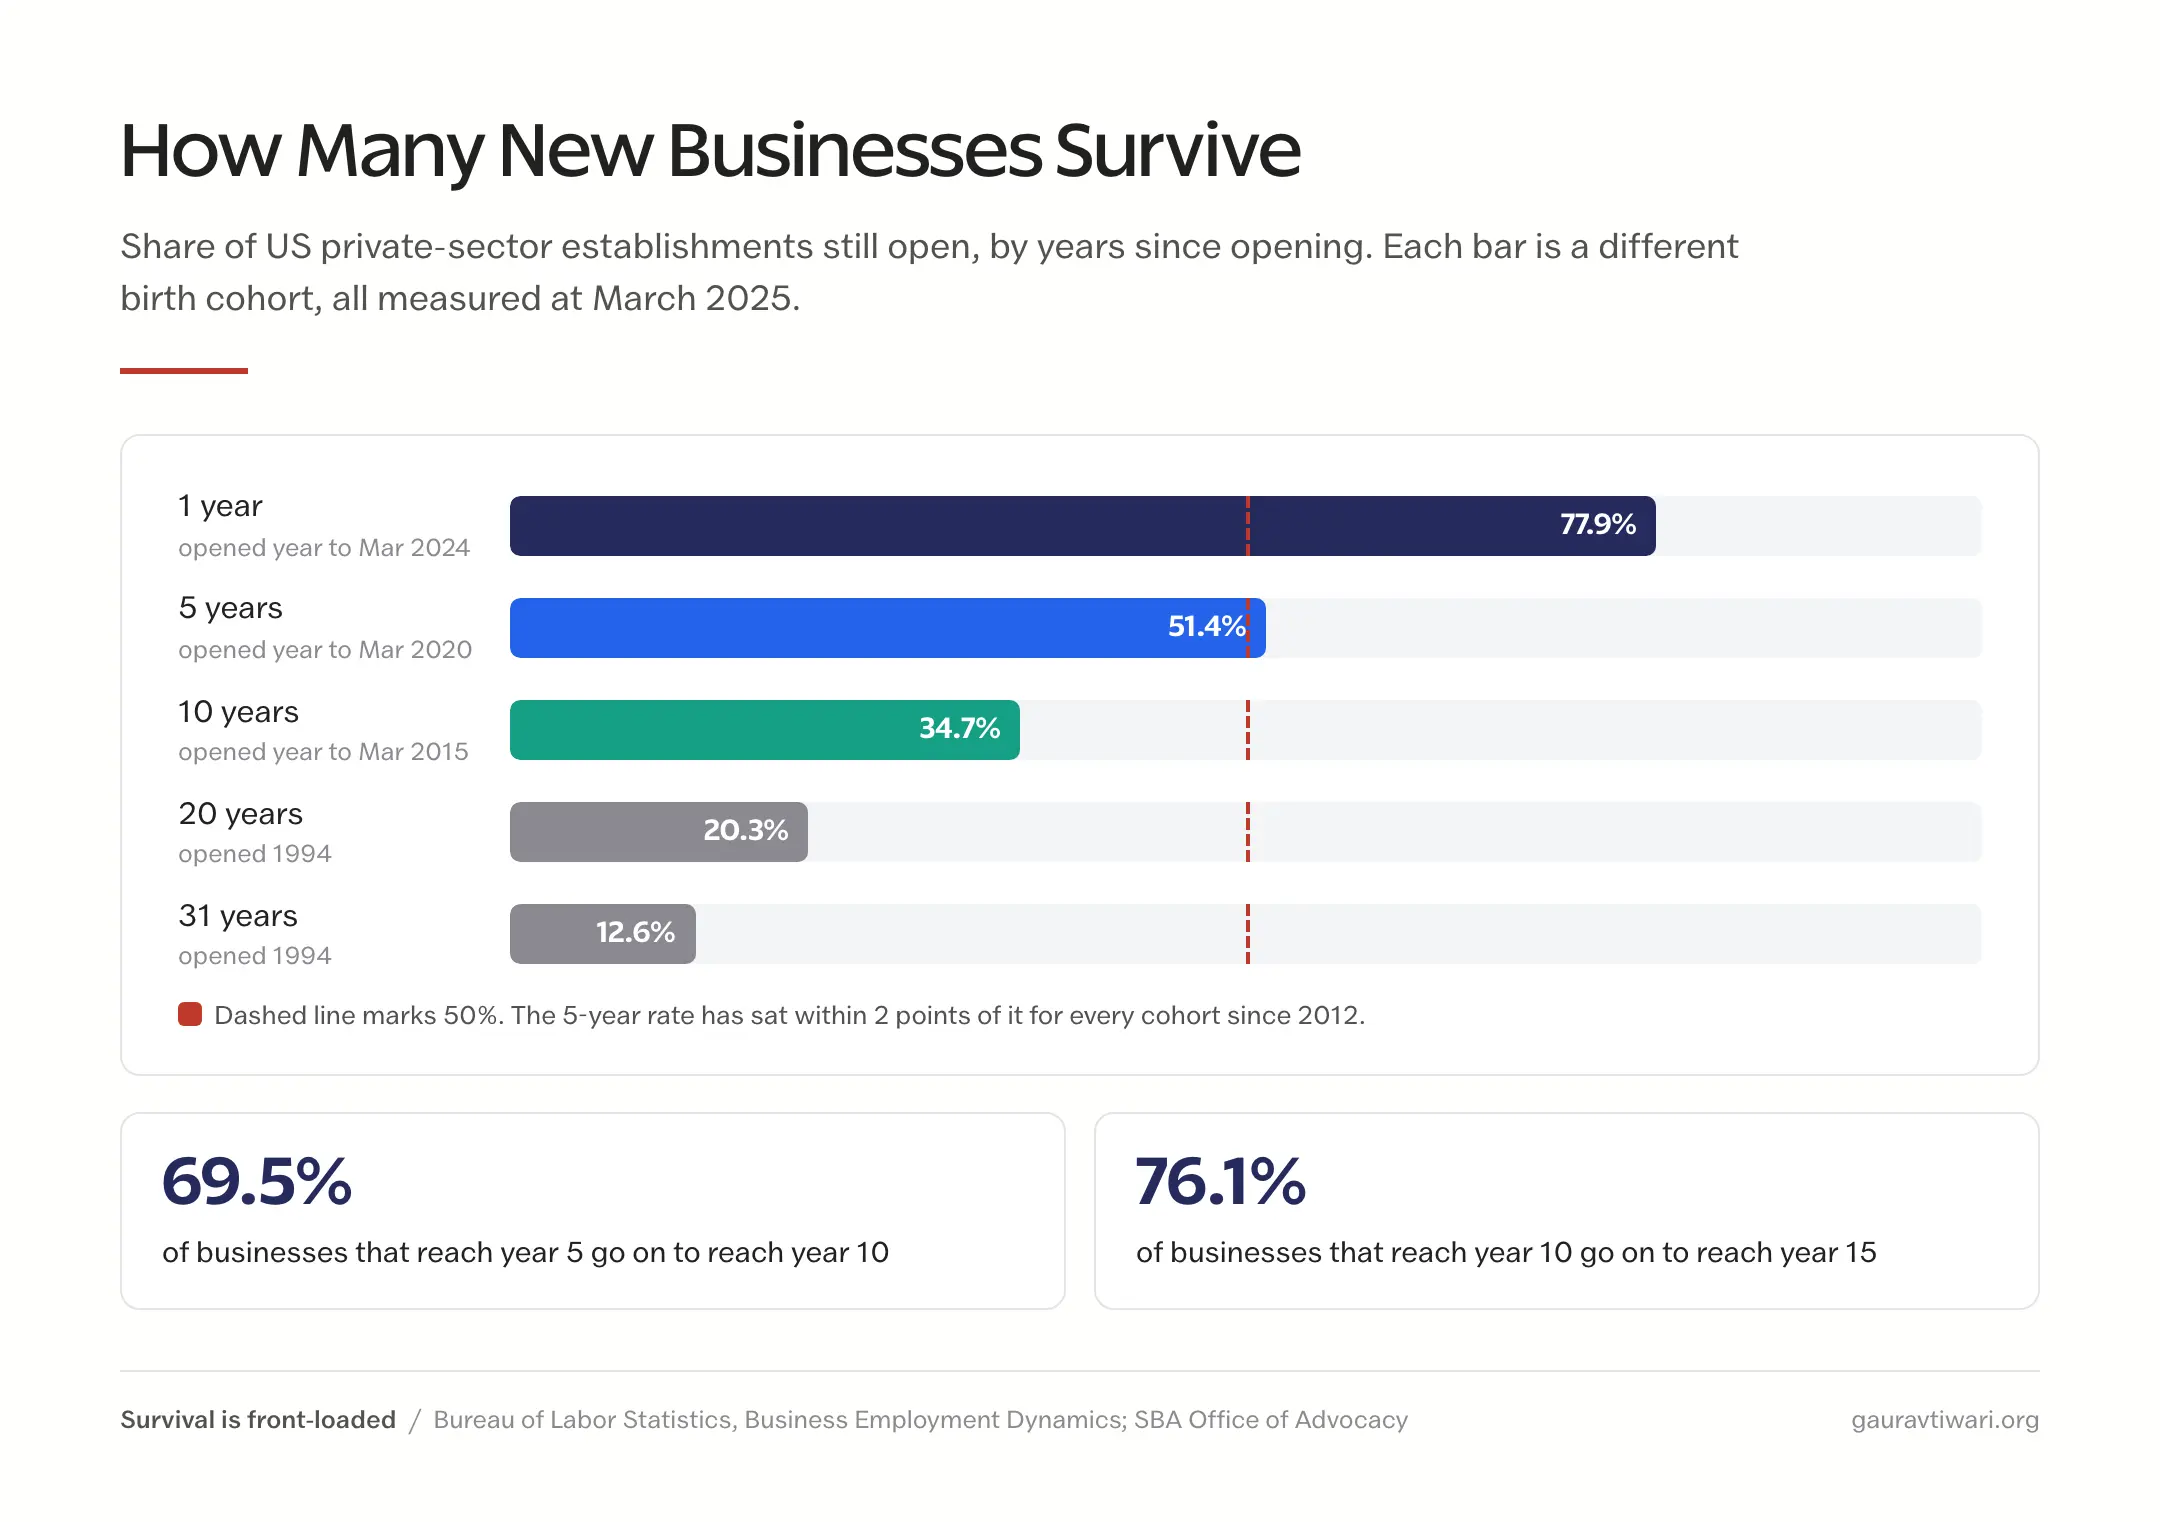
SBA’s long-run averages across every cohort from 1994 to 2022 land in the same place: 67.7% at 2 years, 49.2% at 5, 33.9% at 10, 25.5% at 15. Five-year survival was 50.1% for businesses opened in 2012, 50.6% for 2013, 51.5% for 2019, and 51.4% for 2020.
Flat. Through a pandemic.
The more useful way to read the curve is conditionally. Of businesses that reach year 5, 69.5% reach year 10, and of those that reach 10, 76.1% reach 15. The risk is front-loaded. An owner who has made it through the fifth year is not facing a coin flip anymore; the odds have moved well in their favor, and most of the remaining closures are retirements, sales, and relocations rather than failures, because BLS counts every closure the same way.
Survival by Industry
Sector matters less than people assume, and the sector everyone names as a graveyard is mid-table.
| Sector | Survival | Horizon |
|---|---|---|
| Agriculture, forestry, fishing | 53.0% | 10 years, highest of any sector |
| Construction | 56.5% / 42.6% | 5 years / 10 years |
| Health care | 52.6% | 5 years |
| Information | 71.6% | 1 year, lowest first-year rate |
| Mining, oil and gas | 24.5% | 10 years, lowest of any sector |
Construction is the one worth dwelling on, because the “90% of construction companies fail” line is everywhere and the measured figure is 57% over a decade. Its 5-year survival beats the all-industry average. The sector has a reputation problem, not a survival problem.
Why Businesses Fail
CB Insights rebuilt its failure-reasons analysis in March 2026 from 431 VC-backed startups that shut down since 2023, 385 of them with identifiable causes. The ranking looks nothing like the version most articles still quote.
- Ran out of capital: 70%
- Poor product-market fit: 43%
- Bad timing or macro conditions: 29%
- Unsustainable unit economics: 19%
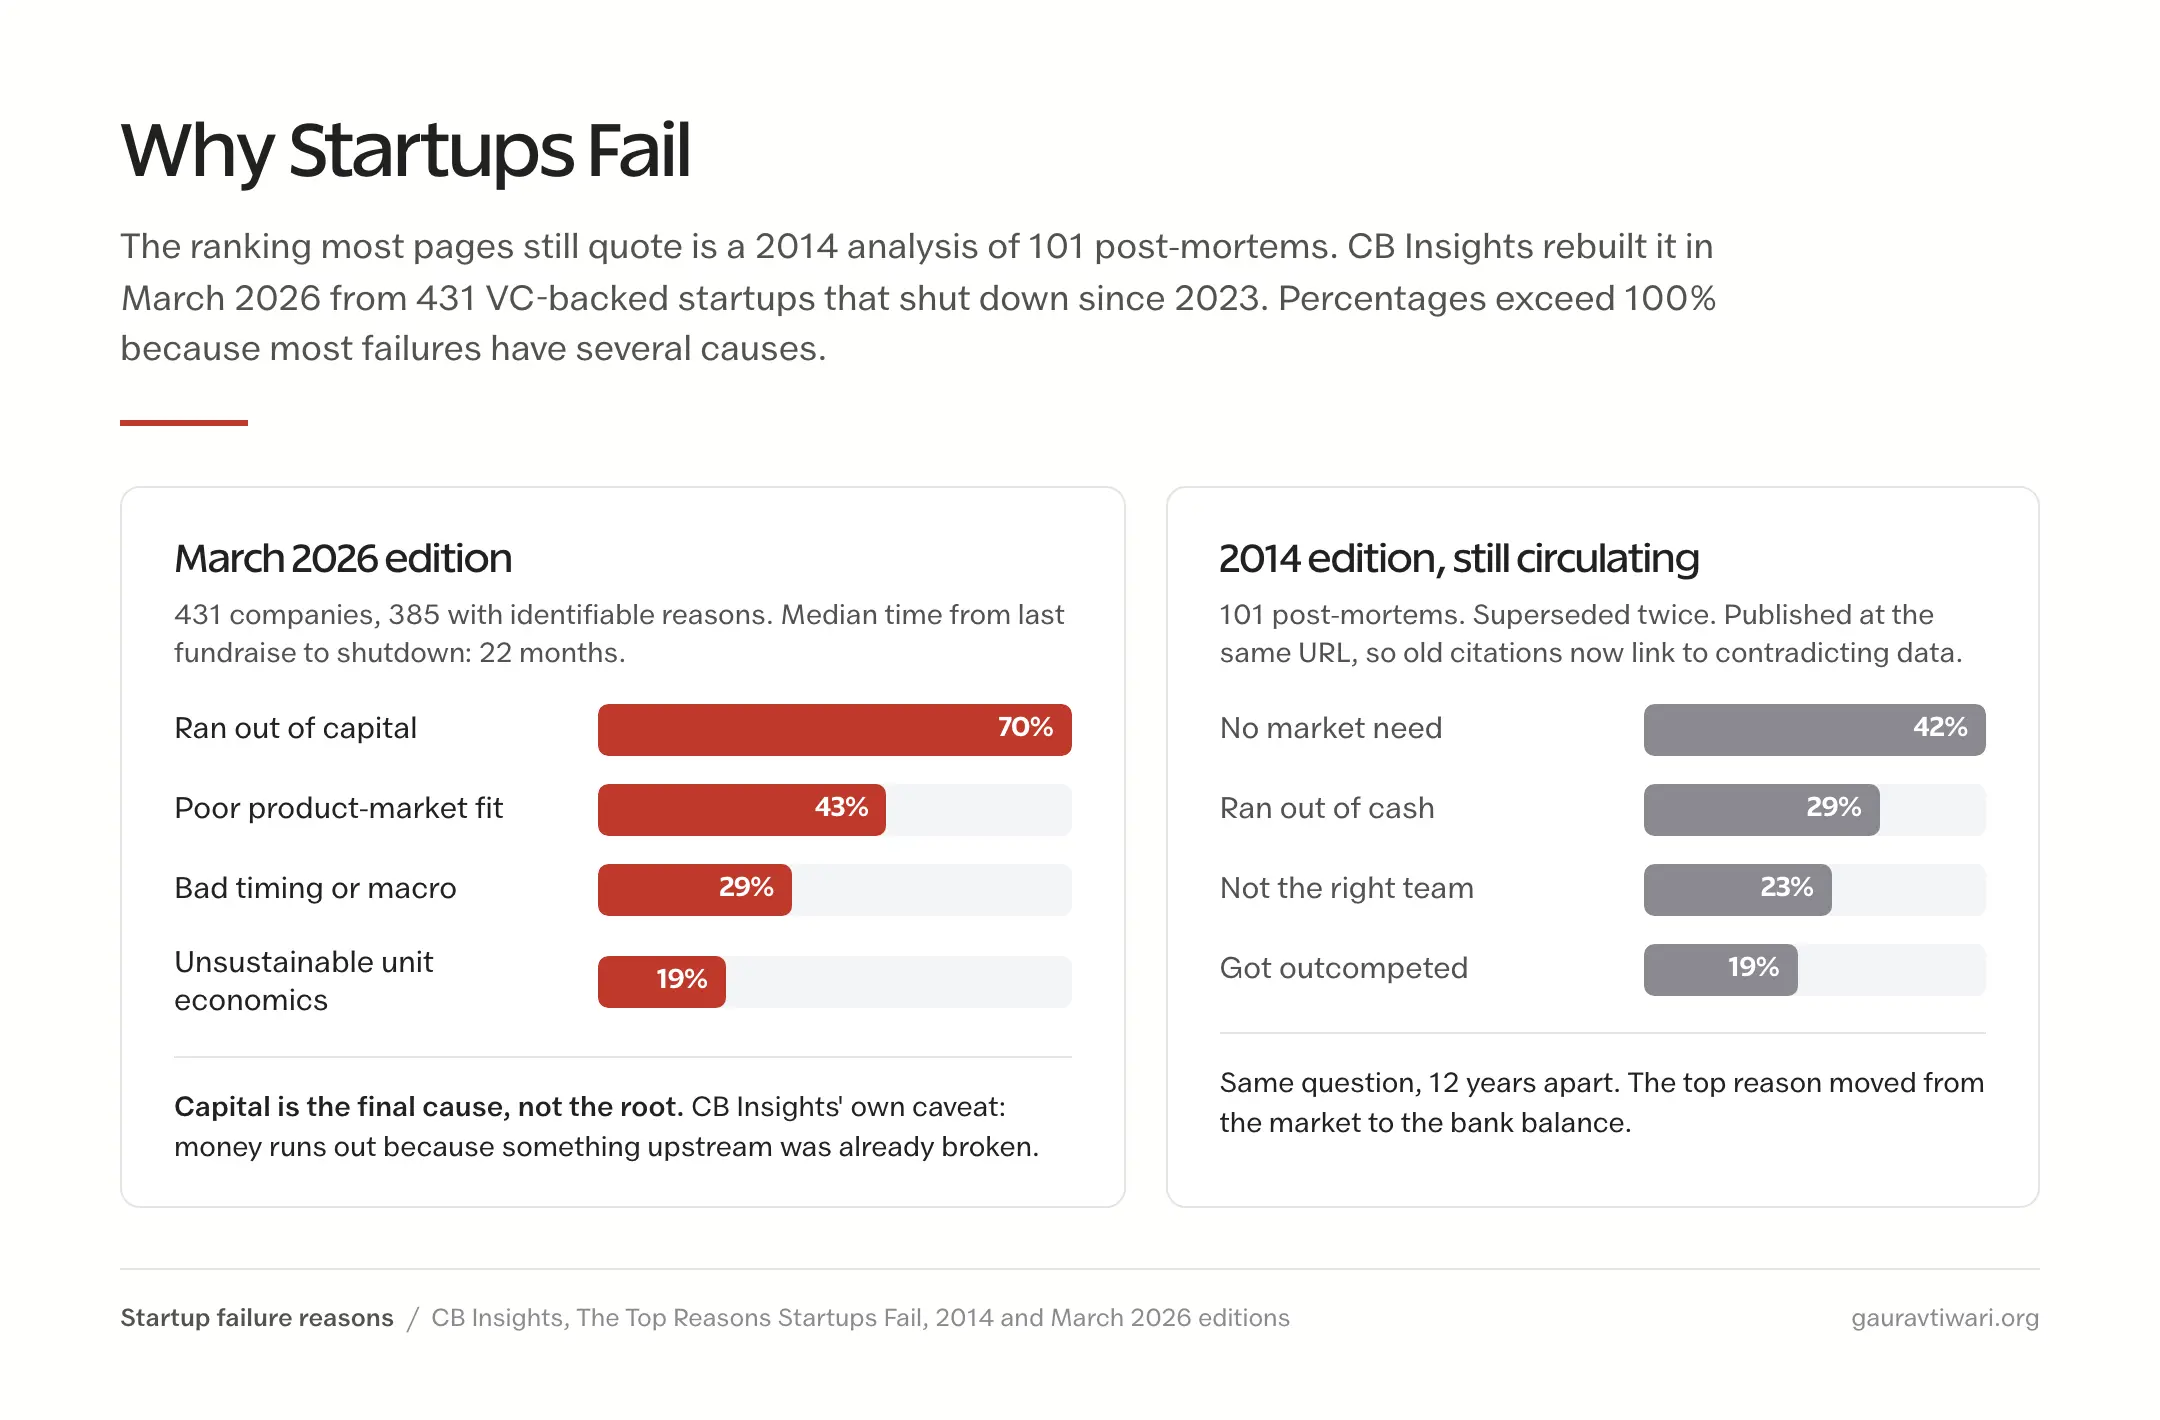
The percentages pass 100% because most failures have several causes. The same 431 companies had raised $17.5 billion between them, with a median raise of $11 million, and the median time from their last fundraise to shutdown was 22 months.
The old list, with “no market need” at 42% on top, dates from a 2014 analysis of 101 post-mortems. It has been superseded twice and CB Insights publishes each edition at the same URL, so a citation that was correct in 2019 now links to a page that contradicts it.
CB Insights adds the caveat that matters: running out of capital is almost always the final cause of death, not the root one. Money runs out because something upstream was already broken. But the ordering still tells you where the clock is, and the clock is cash. If you are close to that line, the cash flow failures that take down otherwise healthy businesses are worth reading before the funding section below.
Revenue and Profit Margins
The best public margin data comes from Aswath Damodaran at NYU Stern, updated each January from 5,994 US firms. The January 2026 set, reflecting fiscal 2025, puts the whole-market net margin at 9.74% and gross margin at 37.76%.
Two things about that dataset trip people up. It covers listed companies, so it describes the margin structure of industries, not what a 4-person shop in the same industry earns. And Damodaran publishes single point values per industry, never ranges. Any “restaurants run 3 to 5% net margins, per NYU Stern” style claim was constructed downstream; his actual restaurant figure is 9.37%.
| Industry | Net margin |
|---|---|
| Total market | 9.74% |
| Restaurant and dining | 9.37% |
| Retail, building supply | 7.84% |
| Business and consumer services | 7.03% |
| Retail, general | 5.61% |
| Retail, special lines | 5.19% |
| Retail, automotive | 3.36% |
| Retail, grocery and food | 1.32% |
Grocery is the one to remember. A supermarket keeps about 1.3 cents of every dollar, which is why volume, shrink, and supplier terms decide that business and price almost never does.
For small firms specifically, the data is thinner and worth labelling. Guidant Financial’s 2026 survey found 57.5% of owners currently profitable, down from 65% a few years earlier, but Guidant surveys its own financing customers, a self-selected group. The Census Bureau’s nonemployer statistics for 2023 put average receipts for a solo business at roughly $58,000, across 30.4 million establishments and about $1.8 trillion in receipts. That average is pulled up by a long tail; most solo operations earn far less.
Owner pay figures that circulate, including a widely repeated “$77,823 average salary,” come from a few hundred self-reported profiles on salary sites and should not be read as national estimates. If you are setting up the books for the first time, accounting software that separates owner draw from business income will give you a better number for your own situation than any survey will.
Business Funding Statistics
Venture funding set a record in 2025 and then broke it inside 6 months. Crunchbase now puts 2025 global venture at $440 billion, revised up from the $425 billion it first reported in January, and the first half of 2026 at $510 billion, more than the whole of the year before.
Almost none of that money is reaching the typical startup. It is concentrating, by sector, by geography, and by company.
- AI took $211 billion of 2025’s total, about half, up 85% on 2024
- In the first quarter of 2026, AI took $242 billion of $300 billion, roughly 80%
- OpenAI and Anthropic alone raised $217 billion in the first half of 2026, 43% of all venture funding worldwide
- 4 of the 5 largest venture rounds ever closed in one quarter: OpenAI $122 billion, Anthropic $30 billion, xAI $20 billion, Waymo $16 billion
- The US share of global venture went from 56% in 2024 to 64% in 2025 to 83% in the first quarter of 2026
- Within the US, the San Jose, San Francisco, and Oakland metro took 52.4% of deal value in 2025 on 22.3% of deal count (PitchBook-NVCA)
A record funding year in which 2 companies absorb 43% of the capital is not a record year for founders. It is a record year for 2 companies.
Round Sizes and Graduation Rates
Below the mega-rounds, the picture for an ordinary startup is the tightest it has been in years. The PitchBook-NVCA Venture Monitor for full-year 2025 gives the US medians.
- Median pre-seed round: $500,000, at a median pre-money valuation of $8.3 million
- Median seed: $3.8 million (Carta puts it at $4.1 million for the first half of 2026)
- Median Series A: $15.0 million, at a median pre-money valuation of $49.0 million
- Only 15.4% of the 2022 seed cohort raised a Series A within 2 years, the lowest graduation rate on record, against 30.6% for the 2018 cohort (Carta)
- 46% of seed deals in the first quarter of 2025 were bridge rounds
- Down rounds fell to 11.4% of new rounds in the first quarter of 2026, from a 22% peak in 2023, the one indicator that has clearly improved
The seed-to-A graduation rate is the number a founder should actually plan around. Half as many seed companies reach the next round as did 7 years ago. The median 616 days between seed and Series A that gets quoted measures only the companies that made it, so it flatters the path; Carta’s broader time-between-rounds figure was 774 days at the end of 2024.
Exits reopened in 2025 without becoming easy. US exit value reached $297.6 billion across about 1,635 exits, but only 48 of those were IPO listings, which PitchBook describes as an opportunistic reopening rather than a systemic one. The second quarter of 2026 was the strongest exit quarter since 2021, with 24 acquisitions above $1 billion totalling $113 billion.
Angel Investment
The UNH Center for Venture Research is the only long-running primary source on US angel activity, and its most recent report covers 2024. No 2025 edition exists yet, so any “2025 angel investment” figure you see is not from the source.
- Total US angel investment: $17.9 billion in 2024, down 3.1%
- Ventures funded: 55,346, an average of about $323,000 each
- The often-quoted 22% return is an IRR for angel groups from a 2016 study, not a figure about angel investing in general
For most founders the practical question is not the national total but which source of capital fits the stage, and the guide to raising startup capital walks through that decision with the tradeoffs at each step.
Ecommerce Statistics
Online retail is growing in the high single digits, not the double digits most roundups still carry. eMarketer puts worldwide retail ecommerce at $6.42 trillion in 2025, up 6.8%, and forecasts $6.88 trillion in 2026, up 7.2%, which would be 21.1% of all retail.
The US picture from the Census Bureau, which is the only source here that measures rather than models:
- US ecommerce sales: $1.234 trillion in 2025, up 5.4%
- Share of total retail: 16.4% for 2025, and 17.1% in the second quarter of 2026
- Amazon: 40.5% of US retail ecommerce in 2025, still gaining share (eMarketer)
- Mobile commerce: about $2.5 trillion worldwide in 2025; mobile accounts for roughly 71% of retail ecommerce orders (Statista)
- Social commerce: about $586 billion forecast for 2026, 15.2% of ecommerce, with China around $366 billion of it (Statista)
- Cart abandonment: 70.22%, a long-run average across 50 studies spanning 2006 to 2025 (Baymard Institute)
The 16.4% figure is lower than the 20%-plus you will see elsewhere for a definitional reason worth knowing. Census divides by all retail trade, including car dealers and petrol stations, which barely sell online and drag the ratio down. Analysts who strip those out get a higher share. Neither is wrong; they answer different questions, and a page that quotes the higher figure with a Census attribution has mixed them up.
Census also changed its method in April 2025, removing nonemployer businesses from the ecommerce series. Pre-2025 and post-2025 shares are not directly comparable, which is one more reason a single trend line drawn through both is suspect.
On cart abandonment, 70% is a useful anchor and a poor target. It blends studies from 2006 with studies from 2025, and the individual inputs range from 57% to 84%. Your own number, measured on your own checkout, is the only one worth optimizing against.
Marketing and Customer Acquisition
Customer acquisition cost benchmarks come almost entirely from one agency’s client data, which is worth knowing before you compare yourself to them. FirstPageSage publishes blended CAC by industry from its own clients, January 2022 to August 2025, last updated January 2026.
- B2B SaaS: $239 blended ($205 organic, $341 paid)
- Direct-to-consumer ecommerce: $86
- Financial services: $784 ($644 organic, $1,202 paid)
- Fintech: $1,450; insurance: $1,280; legaltech: $299
Two caveats. The “$702 B2B SaaS CAC” that circulates appears in no FirstPageSage report; it is a misattribution that has been copied between roundups. And an SEO agency’s client base skews toward companies where organic acquisition already works, so its headline finding that organic beats paid in almost every industry is partly a selection effect.
The “healthy LTV to CAC ratio is 3 to 1” rule belongs in a different category entirely. It is not a measured benchmark. It comes from a 2009 essay by David Skok, who later described the guidelines as early guesses that held up. Useful heuristic, not a statistic.
Marketing ROI by Channel
The channel figures people quote most are the ones that have aged worst.
- Email. Litmus no longer publishes a single ROI number. Its 2025 survey of about 500 marketers reports a distribution: 35% earn $10 to $36 per dollar, 30% earn $36 to $50, 5% earn more than $50. The famous “$36 per $1” is a bucket boundary from the 2020 survey
- Organic search. BrightEdge’s “53% of trackable traffic” is real, and it describes May 2019. The company has not refreshed it. Its September 2025 research says AI search sends under 1% of referral traffic but gives no new share
- Paid search. Median cost per click across all industries is $5.42 for April 2025 to March 2026, up from $4.66 two years earlier, ranging from $1.63 in arts and entertainment to $9.87 for attorneys (LocaliQ, formerly WordStream)
- Budgets. Marketing spend averages 7.8% of company revenue in 2026, up from 7.7%, among 401 mostly $1 billion-plus enterprises (Gartner CMO Spend Survey, May 2026)
- Content. 97% of surveyed B2B marketers say they have a content strategy (Content Marketing Institute, October 2025). The sample is drawn from CMI’s own mailing lists, so it measures content marketers, not B2B companies
The email figure is the one to fix in your own deck. Two-thirds of companies report somewhere between $10 and $50 back per dollar, which is still the best return in marketing, and a range is a more defensible thing to put in front of a client than a single number that its own publisher retired. If you are choosing a platform, the comparison of email marketing tools covers where the cost differences actually come from.
AI Adoption in Business
Two surveys ask whether businesses use AI and get answers 10 times apart, and both are right. The difference is who they asked.
- The Census Bureau’s Business Trends and Outlook Survey, cited in SBA’s February 2026 FAQ, found 7.6% of US businesses used AI between September 2024 and August 2025
- Firms with more than 250 employees led at 11.4%. Second place went to firms with fewer than 5 employees, at 8.2%, ahead of every mid-sized band
- McKinsey’s State of AI, from 1,993 mostly large organizations surveyed mid-2025, found 88% regularly using AI in at least one function and 79% using generative AI
- Of those McKinsey respondents, only 7% had fully scaled AI across the enterprise; about a third had begun scaling at all
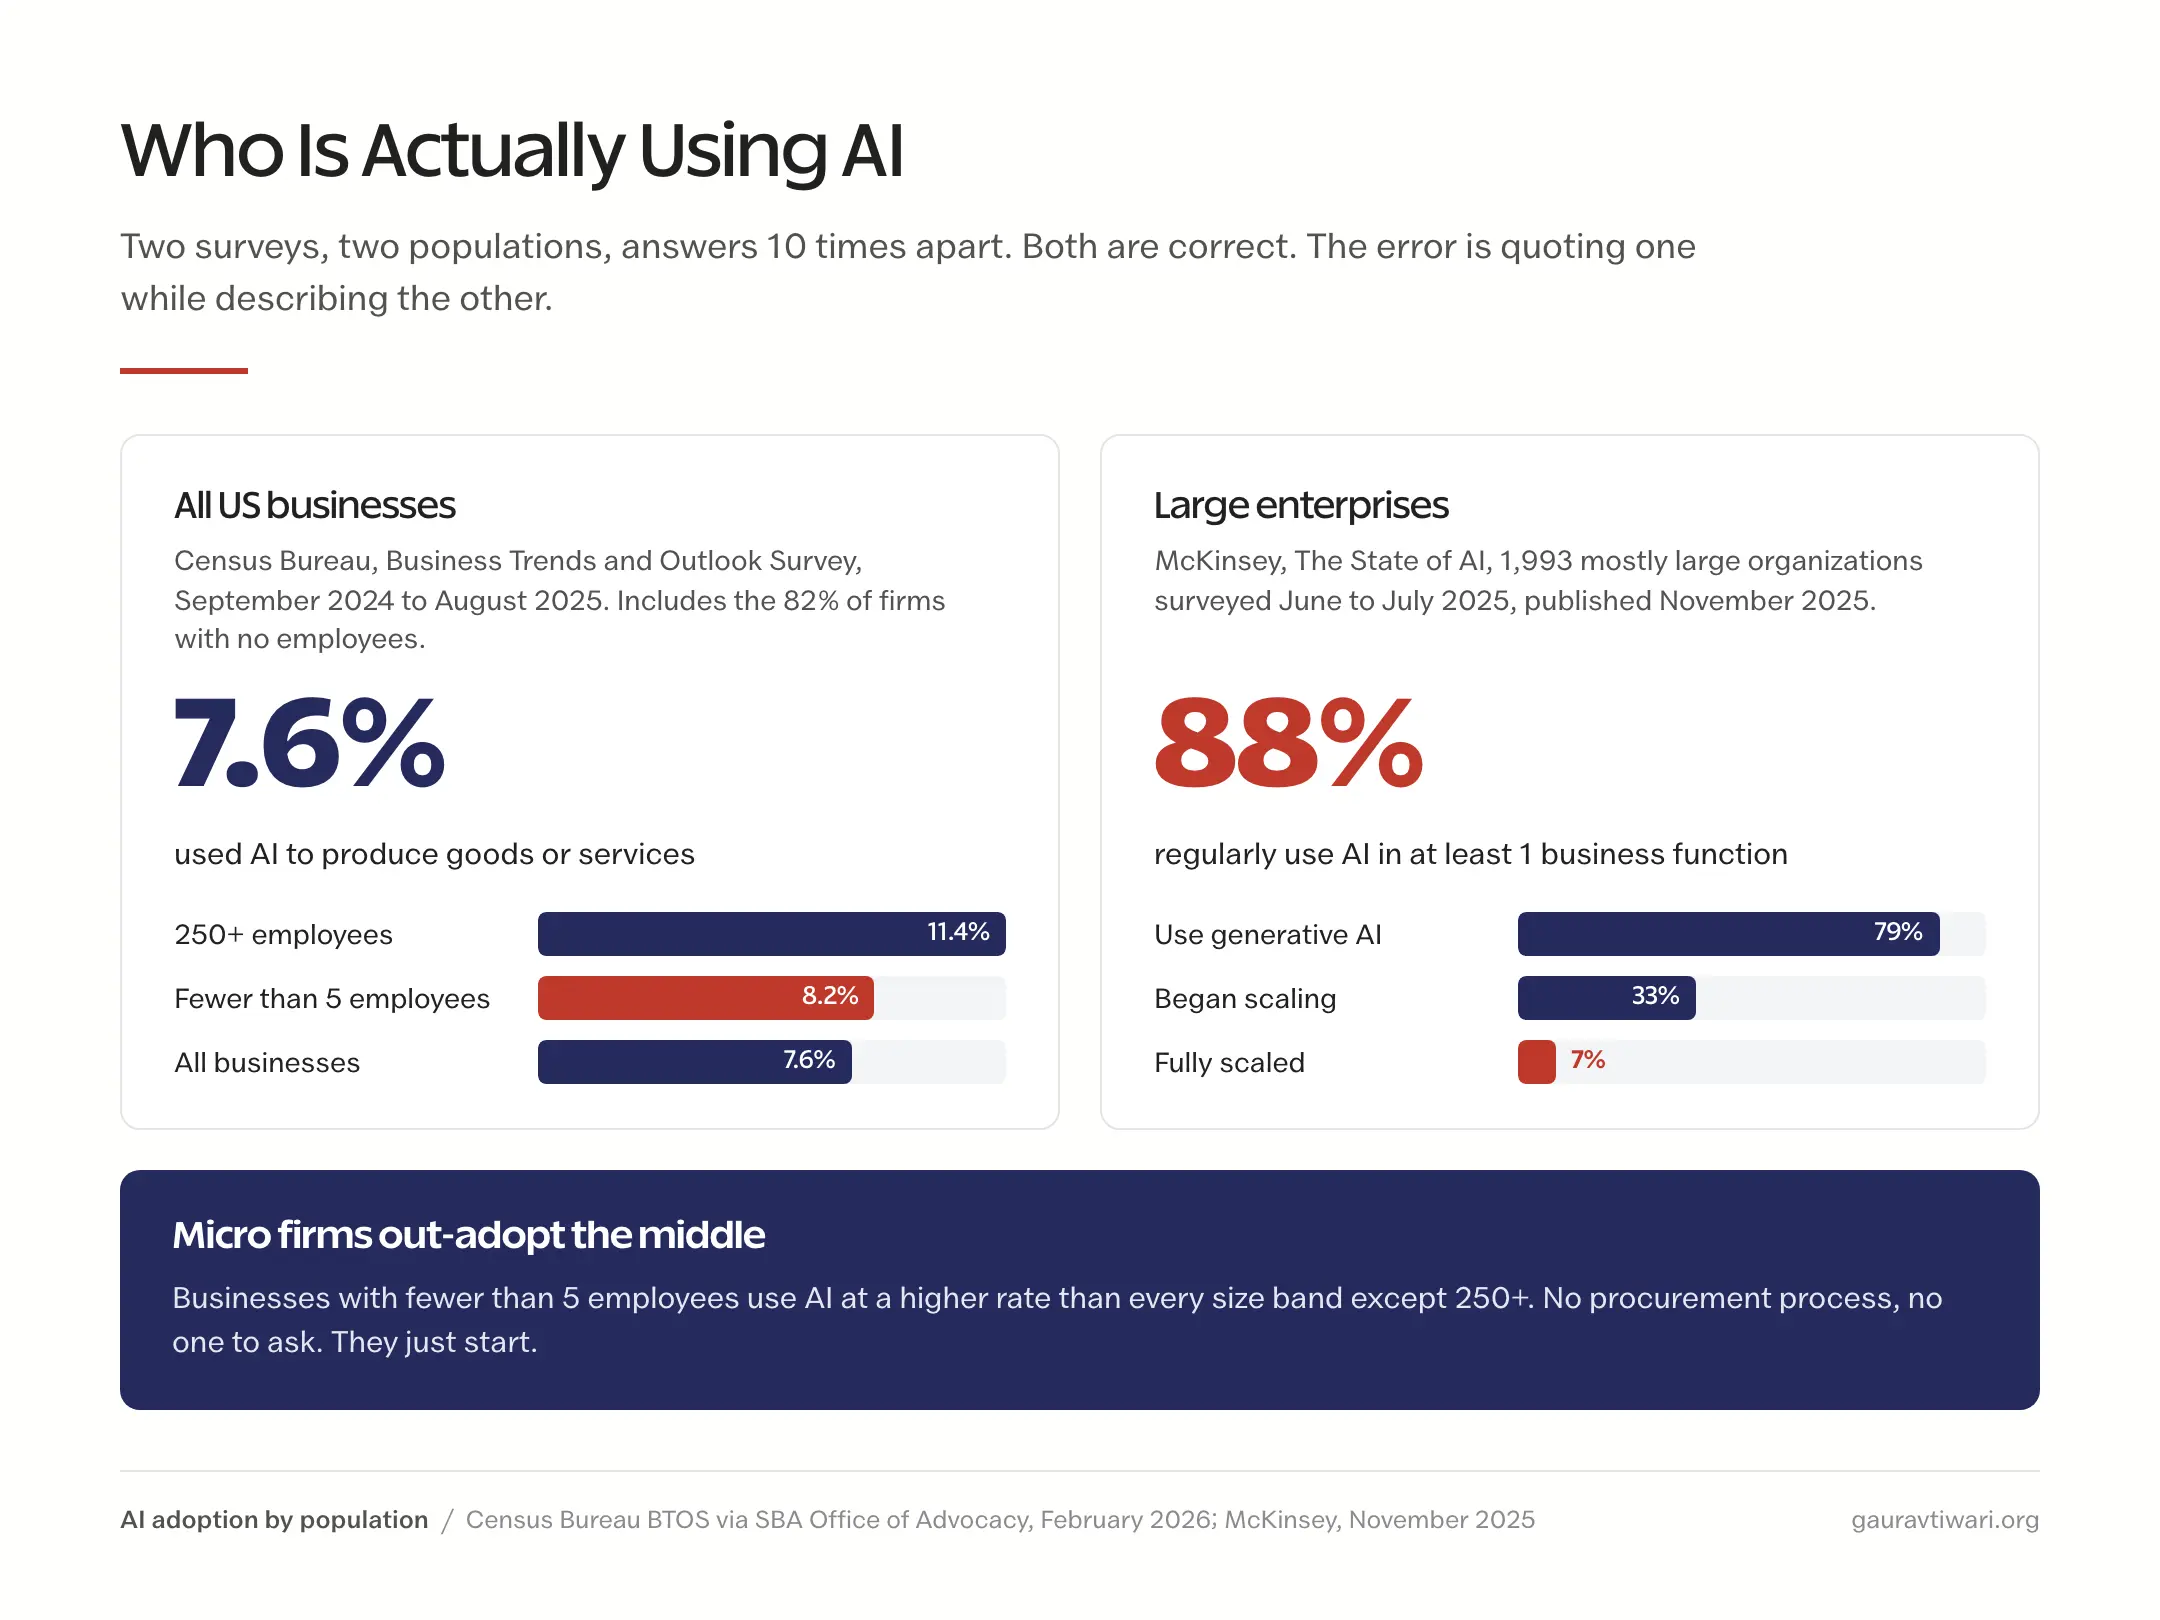
Quoting McKinsey’s 88% in a piece about small business is the single most common framing error on this topic. McKinsey measures enterprises with functions and budgets. Census measures every business, including the 82% with no employees. The small-business figure is under 10%.
The buried finding is the interesting one. Solo and micro businesses adopt AI at a higher rate than companies with 20, 50, or 100 staff. A one-person firm has no procurement process and no one to ask. It just starts.
Spending figures, with their scopes, since “AI market” numbers differ by a factor of 5 depending on what is counted:
- Worldwide AI spending: $1.5 trillion in 2025, forecast to grow 47% in 2026, with AI software at $282.9 billion and AI services at $436.4 billion inside that (Gartner, May 2026)
- Information security spending: $213 billion in 2025, forecast at $239.8 billion for 2026 (Gartner, July 2025)
- Average cost of a data breach: a record high in 2026, up 12% on the 2025 figure of $4.4 million, which had itself been a rare decline (IBM and Ponemon Institute)
- About 96% of ransomware victims where organization size is known were businesses under 1,000 employees (Verizon Data Breach Investigations Report 2026)
The breach figure that still circulates, $4.88 million, is from the 2024 report. It is 2 editions old and on the wrong side of a reversal: costs fell, then hit a record. A number can be recent and still point the wrong way.
Remote Work Statistics
Work location has settled. The Survey of Working Arrangements and Attitudes, run by Stanford’s Nick Bloom and colleagues, surveyed 39,061 full-time wage and salary employees in its July 2026 wave.
- 12% fully remote, 26% hybrid, 62% fully on site
- Hybrid employees average 2.78 days a week in the office, and that figure has been rising (Flex Index)
- Bloom’s 2024 randomized trial of more than 1,600 employees, published in Nature, found no productivity difference between hybrid and full-time office work, and quit rates about a third lower for hybrid staff
- Upwork’s final Freelance Forward survey, from December 2023, counted 64 million Americans freelancing, 38% of the workforce. Upwork has not published a newer edition
- The average monthly quits rate was 2.0% in 2025 (BLS Job Openings and Labor Turnover Survey)
The productivity finding is the one most people have backwards. The “remote workers are 13% more productive” claim comes from Bloom’s 2013 call-center experiment in China. His own 2024 study, larger and more recent, found no difference either way. The case for hybrid is retention, not output.
Business Demographics
Ownership data comes from the Census Bureau’s Annual Business Survey and nonemployer demographics, compiled by SBA. The most recent data year is 2022.
- Women own 14.0 million businesses, 40.4% of classifiable firms; a further 4.1% are owned equally by women and men
- Minority owners hold 13.0 million businesses, 37.6%
- 5.61 million are Hispanic-owned (16.2%) and 4.63 million Black-owned (13.3%)
- Women-owned businesses grew 17% between 2019 and 2024 against 12% for men-owned (Wells Fargo, January 2025)
- Latino-owned businesses grew 44% between 2018 and 2023 (Stanford Latino Entrepreneurship Initiative, March 2025)
- The mean age of a founder at launch is 41.9; founders of the fastest-growing 0.1% of startups average 45.0 (Azoulay, Jones, Kim, and Miranda, Census data)
- Immigrants start businesses at an 80% higher rate than native-born Americans, 0.83% versus 0.46% (same authors, NBER)
- 59% of US billion-dollar startups, 455 of 775, have at least one immigrant founder; 66% counting children of immigrants (National Foundation for American Policy, June 2026)
The Black-owned figure is worth flagging because the number most pages carry, 3.3 million, understates it by 40%. It appears to be an older vintage that never got updated. And the founder-age finding cuts against a strong cultural story: the median successful founder is in their 40s, not their 20s, and the age climbs as you move toward the top of the growth distribution.
Business Statistics That Are Not True
Business statistics have a worse zombie problem than most fields, because so many are quoted in pitch decks and never checked. These are the ones you will meet most often.
90% of startups fail. There is no study. The line first appears as an unsourced framing sentence in a 2011 Startup Genome report, and 15 years of citation turned it into a statistic. BLS data shows about 65% of establishments gone after 10 years, and you need a 31-year horizon to approach 87%.
82% of businesses fail because of cash flow problems, per US Bank. Attributed for 20 years to a “Jessie Hagen, US Bank” study that nobody can produce. No document, no date, no sample, nothing on US Bank’s site. Cash flow is a real killer, and the CB Insights data above makes that case properly. This number does not.
Email marketing returns $36 for every $1. A bucket edge from a 2020 survey, presented as an average. The publisher now reports a range.
Average VC deal size is $20 million. Crunchbase publishes no such metric. Carta reports average round size, and PitchBook publishes medians by stage, which are the numbers to use.
Restaurants run 3 to 5% net margins, per NYU Stern. Damodaran publishes point values, never ranges, and his restaurant figure is 9.37%. Every range attributed to him was built by someone else.
The pattern is the same each time. A number gets published once with a date, a sample, and a method. It gets quoted without them. Then it gets quoted from the quote, and by the fourth hop nobody can say what was measured or when. If a statistic arrives without a year attached, assume the year is older than you would like.
The Limits of This Data
These numbers are better sourced than most, and they still have edges worth knowing.
- Official data lags by 2 to 4 years. The SBA’s 2026 FAQ describes 2022. Anything labelled “current” from a government source is usually describing the world before the last 2 interest-rate cycles
- BLS counts every closure as a closure. Sales, retirements, and relocations sit in the same column as failures, so the real failure rate is lower than the survival curve implies
- Venture data describes a tiny slice. Fewer than 1% of businesses ever raise venture capital. Funding statistics say almost nothing about the other 99%
- Survey-based figures are self-selected. Guidant surveys its own customers, CMI its own subscribers, FirstPageSage its own clients. Each is useful about its own population and weak as a national estimate
- Market-size projections are models, not measurements. Two research firms can differ by 2 times on the same market in the same year, depending on scope. A single market-size figure without its scope is not information
None of that makes the picture unusable. It means the direction of each trend is far more trustworthy than any single decimal, and a statistic quoted to 2 decimal places in this field is a sign the number was never read off a source.
Frequently Asked Questions
How many small businesses are there in the US?
The SBA Office of Advocacy counts 36.2 million small businesses, 99.9% of all US firms, in its February 2026 FAQ using 2022 data. About 29.8 million (82.3%) have no employees and 6.4 million (17.7%) have payroll. Together they employ 62.3 million people and produce 43.5% of GDP.
What percentage of businesses fail in the first 5 years?
About 49%, according to Bureau of Labor Statistics cohort data measured in March 2025: 77.9% of new establishments survive year 1, 51.4% reach year 5, and 34.7% reach year 10. The 5-year rate has stayed between 50% and 52% for every cohort since 2012. BLS counts all closures, including sales and retirements, so the true failure rate is lower.
Why do most startups fail?
Running out of capital, cited by 70% of the 431 VC-backed startups CB Insights analyzed in March 2026, followed by poor product-market fit at 43%, bad timing or macro conditions at 29%, and unsustainable unit economics at 19%. Percentages exceed 100% because most failures have several causes, and CB Insights notes that running out of money is usually the final cause, not the root one.
Is it true that 90% of startups fail?
No. The claim traces to an unsourced sentence in a 2011 Startup Genome report, not a study. Bureau of Labor Statistics data shows about 65% of new establishments have closed after 10 years and 80% after 20, with 12.6% of the 1994 cohort still open at 31 years. Reaching a 90% failure rate takes decades, not the few years the claim implies.
What is the average profit margin for a small business?
Across 5,994 US firms, NYU Stern’s Damodaran dataset for fiscal 2025 puts the net margin at 9.74% and gross margin at 37.76%. Industry point values range from 1.32% for grocery retail to 9.37% for restaurants. Those figures describe listed companies; for small firms, Guidant Financial’s 2026 survey of its own customers found 57.5% currently profitable.
How much does it cost to acquire a customer?
FirstPageSage’s client data, January 2022 to August 2025, gives blended customer acquisition costs of $239 for B2B SaaS, $86 for direct-to-consumer ecommerce, and $784 for financial services. The widely quoted $702 for B2B SaaS appears in none of its reports. The 3 to 1 LTV to CAC rule is a 2009 heuristic from David Skok, not a measured benchmark.
How big is the global ecommerce market?
eMarketer estimates worldwide retail ecommerce at $6.42 trillion in 2025, up 6.8%, and forecasts $6.88 trillion in 2026, which would be 21.1% of total retail. US Census Bureau data puts US ecommerce at $1.234 trillion in 2025, 16.4% of retail sales, with Amazon holding 40.5% of US ecommerce according to eMarketer.
What percentage of businesses use AI?
It depends entirely on which businesses. The Census Bureau’s Business Trends and Outlook Survey found 7.6% of all US businesses used AI in the year to August 2025, led by firms with over 250 employees at 11.4% and firms with fewer than 5 employees at 8.2%. McKinsey’s survey of 1,993 mostly large enterprises found 88% using AI regularly in at least one function. Both are correct for their populations.
Final Remarks
The story in this data is not that business is getting harder. The survival curve has not moved in 30 years, through 2 recessions and a pandemic. What has changed is the distance between the headline numbers and the ones that describe your situation: record applications that mostly never trade, record funding that 2 companies absorb, AI adoption figures measured on a universe you are not in.
That gap is the useful finding. The averages have never described any particular business, and in 2026 they describe fewer than ever, because the distributions behind them have stretched. A median seed round, a conditional survival rate, a margin for your specific retail category: those are numbers you can plan against. A global market size is not.
The odds at year 5 are roughly even. After that they tilt your way. Know which side of the average you are actually on.
Tell Google you want more of this.
Add Gaurav Tiwari as a preferred sourceOne tap, and this site shows up more often in your own Top Stories, AI Overviews and AI Mode. Remove it any time.