
 by
by
The global eLearning market is worth about $406 billion in 2026, and the share of US undergraduates studying fully online has fallen for 3 straight years. Both are true at once, and almost every online education statistics page only tells you the first one, usually with numbers from the 2021 peak dressed up as current.
Most coverage picks a camp. One says online is eating education and quotes a market projection to prove it. The other says the pandemic surge was a blip and points at students drifting back to lecture halls. The measured picture is more specific than either: money, platforms, and corporate training keep growing, while US degree-seeking students have settled at a level well below the 2021 spike and a third of them now say they prefer the classroom.
The market grew. The pandemic cohort went home. Those are different stories.
Every figure below names who measured it and the year the data describes, because this field has an unusual number of projections quoted as achievements and a handful of famous statistics that trace back to a single investment bank note from the year 2000.
Key Online Education Statistics
The figures that carry the rest of this page.
- $406 billion global eLearning market in 2026, up from $353 billion in 2025 (The Business Research Company, August 2026 edition)
- 23.7% of US undergraduates enrolled exclusively online in fall 2024, down from 28% in fall 2021 (National Center for Education Statistics)
- 300 million registered learners across Coursera and Udemy, now one company after their merger closed in May 2026
- 95% of UK undergraduates use AI in some part of their studies, up from 66% two years earlier (Higher Education Policy Institute, March 2026)
- $874 spent per learner on US corporate training in 2025, up from $774 (Training magazine)
- $1.0 billion of EdTech venture funding in the first half of 2026, down from a $20.8 billion full year at the 2021 peak (HolonIQ)
- 12.6% median MOOC completion rate, measured on data that closed in 2013 and never shown to have improved since
- 2.2 billion people still offline, about 26% of the world, with internet use at 23% in low-income countries against 94% in high-income ones (International Telecommunication Union, 2025)
eLearning Market Size
The Business Research Company sizes the global eLearning market at $406.13 billion for 2026, up 15.2% from $352.59 billion in 2025, and projects $701 billion by 2030. That is the largest of the mainstream estimates, and the gap between research firms is the first thing to understand about any number in this section.
- Mordor Intelligence: $275.86 billion in 2026, growing at 10.86% to $461.92 billion by 2031, with North America at 34.7% of the total
- Statista (online education, consumer scope): $199 billion worldwide in 2026 and $82.15 billion in the US, growing at just 2.72% a year to 2031
- HolonIQ’s often-quoted $10 trillion figure is for all of education, not online, and dates from a June 2018 projection the firm has not revised
Three firms, three scopes, a 2 times spread on the same year. None of them is wrong. “eLearning” in one report includes corporate training, K-12 software, and hardware; in another it means consumer courses. A market-size figure without its scope is not information.
The segment figures are more useful than the total, because each one answers a narrower question.
| Segment | 2026 estimate | Projection | Source |
|---|---|---|---|
| Learning management systems | $31.61 billion | $104.04 billion by 2034, 16.1% a year | Fortune Business Insights |
| Corporate eLearning | $115.74 billion | $211.79 billion by 2031, 12.9% a year | Mordor Intelligence |
| Mobile learning | $144.92 billion | $441.11 billion by 2030, 32.1% a year | The Business Research Company, July 2026 |
| AI in education | $9.58 billion | $136.79 billion by 2035, 34.5% a year | Precedence Research, February 2026 |
| AI tutors | $3.55 billion (2025) | $6.45 billion by 2030, 12.7% a year | Mordor Intelligence |
| Language learning | $24.39 billion | $50.82 billion by 2031, 15.8% a year | Mordor Intelligence, August 2026 |
| MOOCs | $31.74 billion | $209.13 billion by 2031, 36.9% a year | Mordor Intelligence |
One thing those rows expose: AI tutoring at $3.55 billion would be more than a third of the entire AI-in-education market at $9.58 billion, and it is growing at a third of the rate. Two firms drew the boundaries differently. That is normal. Treat every projection past 2028 as a statement about the modeller’s assumptions, not the market.
EdTech Funding
Venture money tells a cleaner story than market sizes, because it is counted rather than modelled. HolonIQ tracks it.
- 2021: $20.8 billion, the all-time peak
- 2024: $2.4 billion, an 88.5% fall from the peak
- 2025: $2.6 billion, up about 11%
- First half of 2026: $1.0 billion, down 26% on the same period of 2025
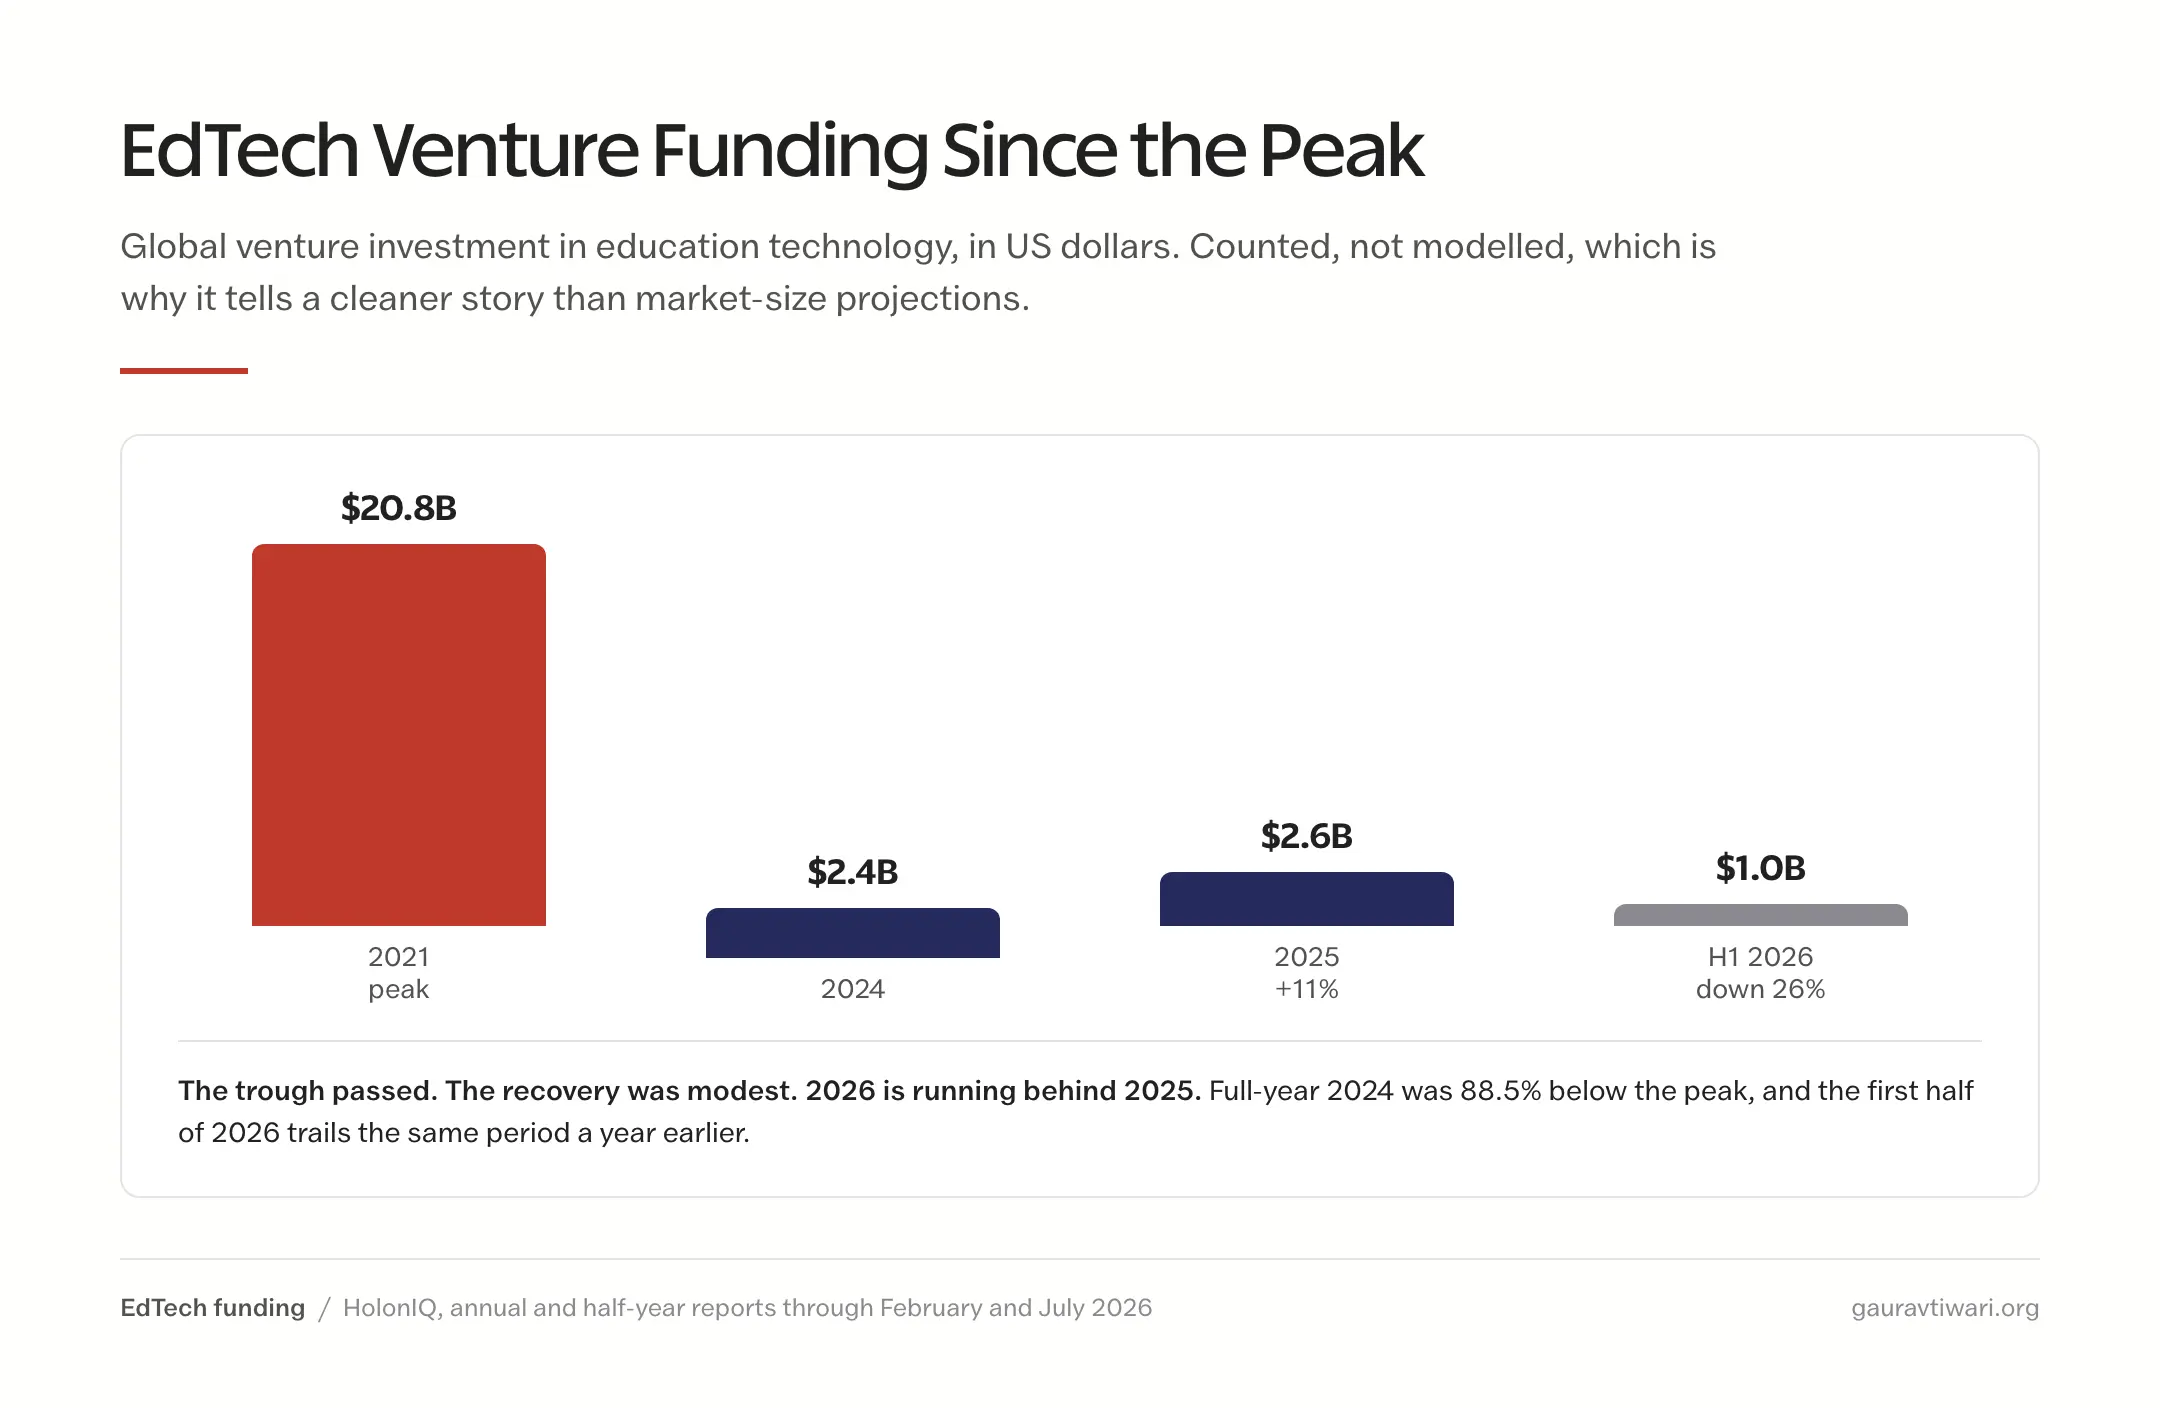
The trough passed in 2024, the recovery was modest, and 2026 is running behind 2025 again. Anyone still writing that “capital will return to EdTech” is describing a cycle that already turned twice.
Online Enrollment Statistics
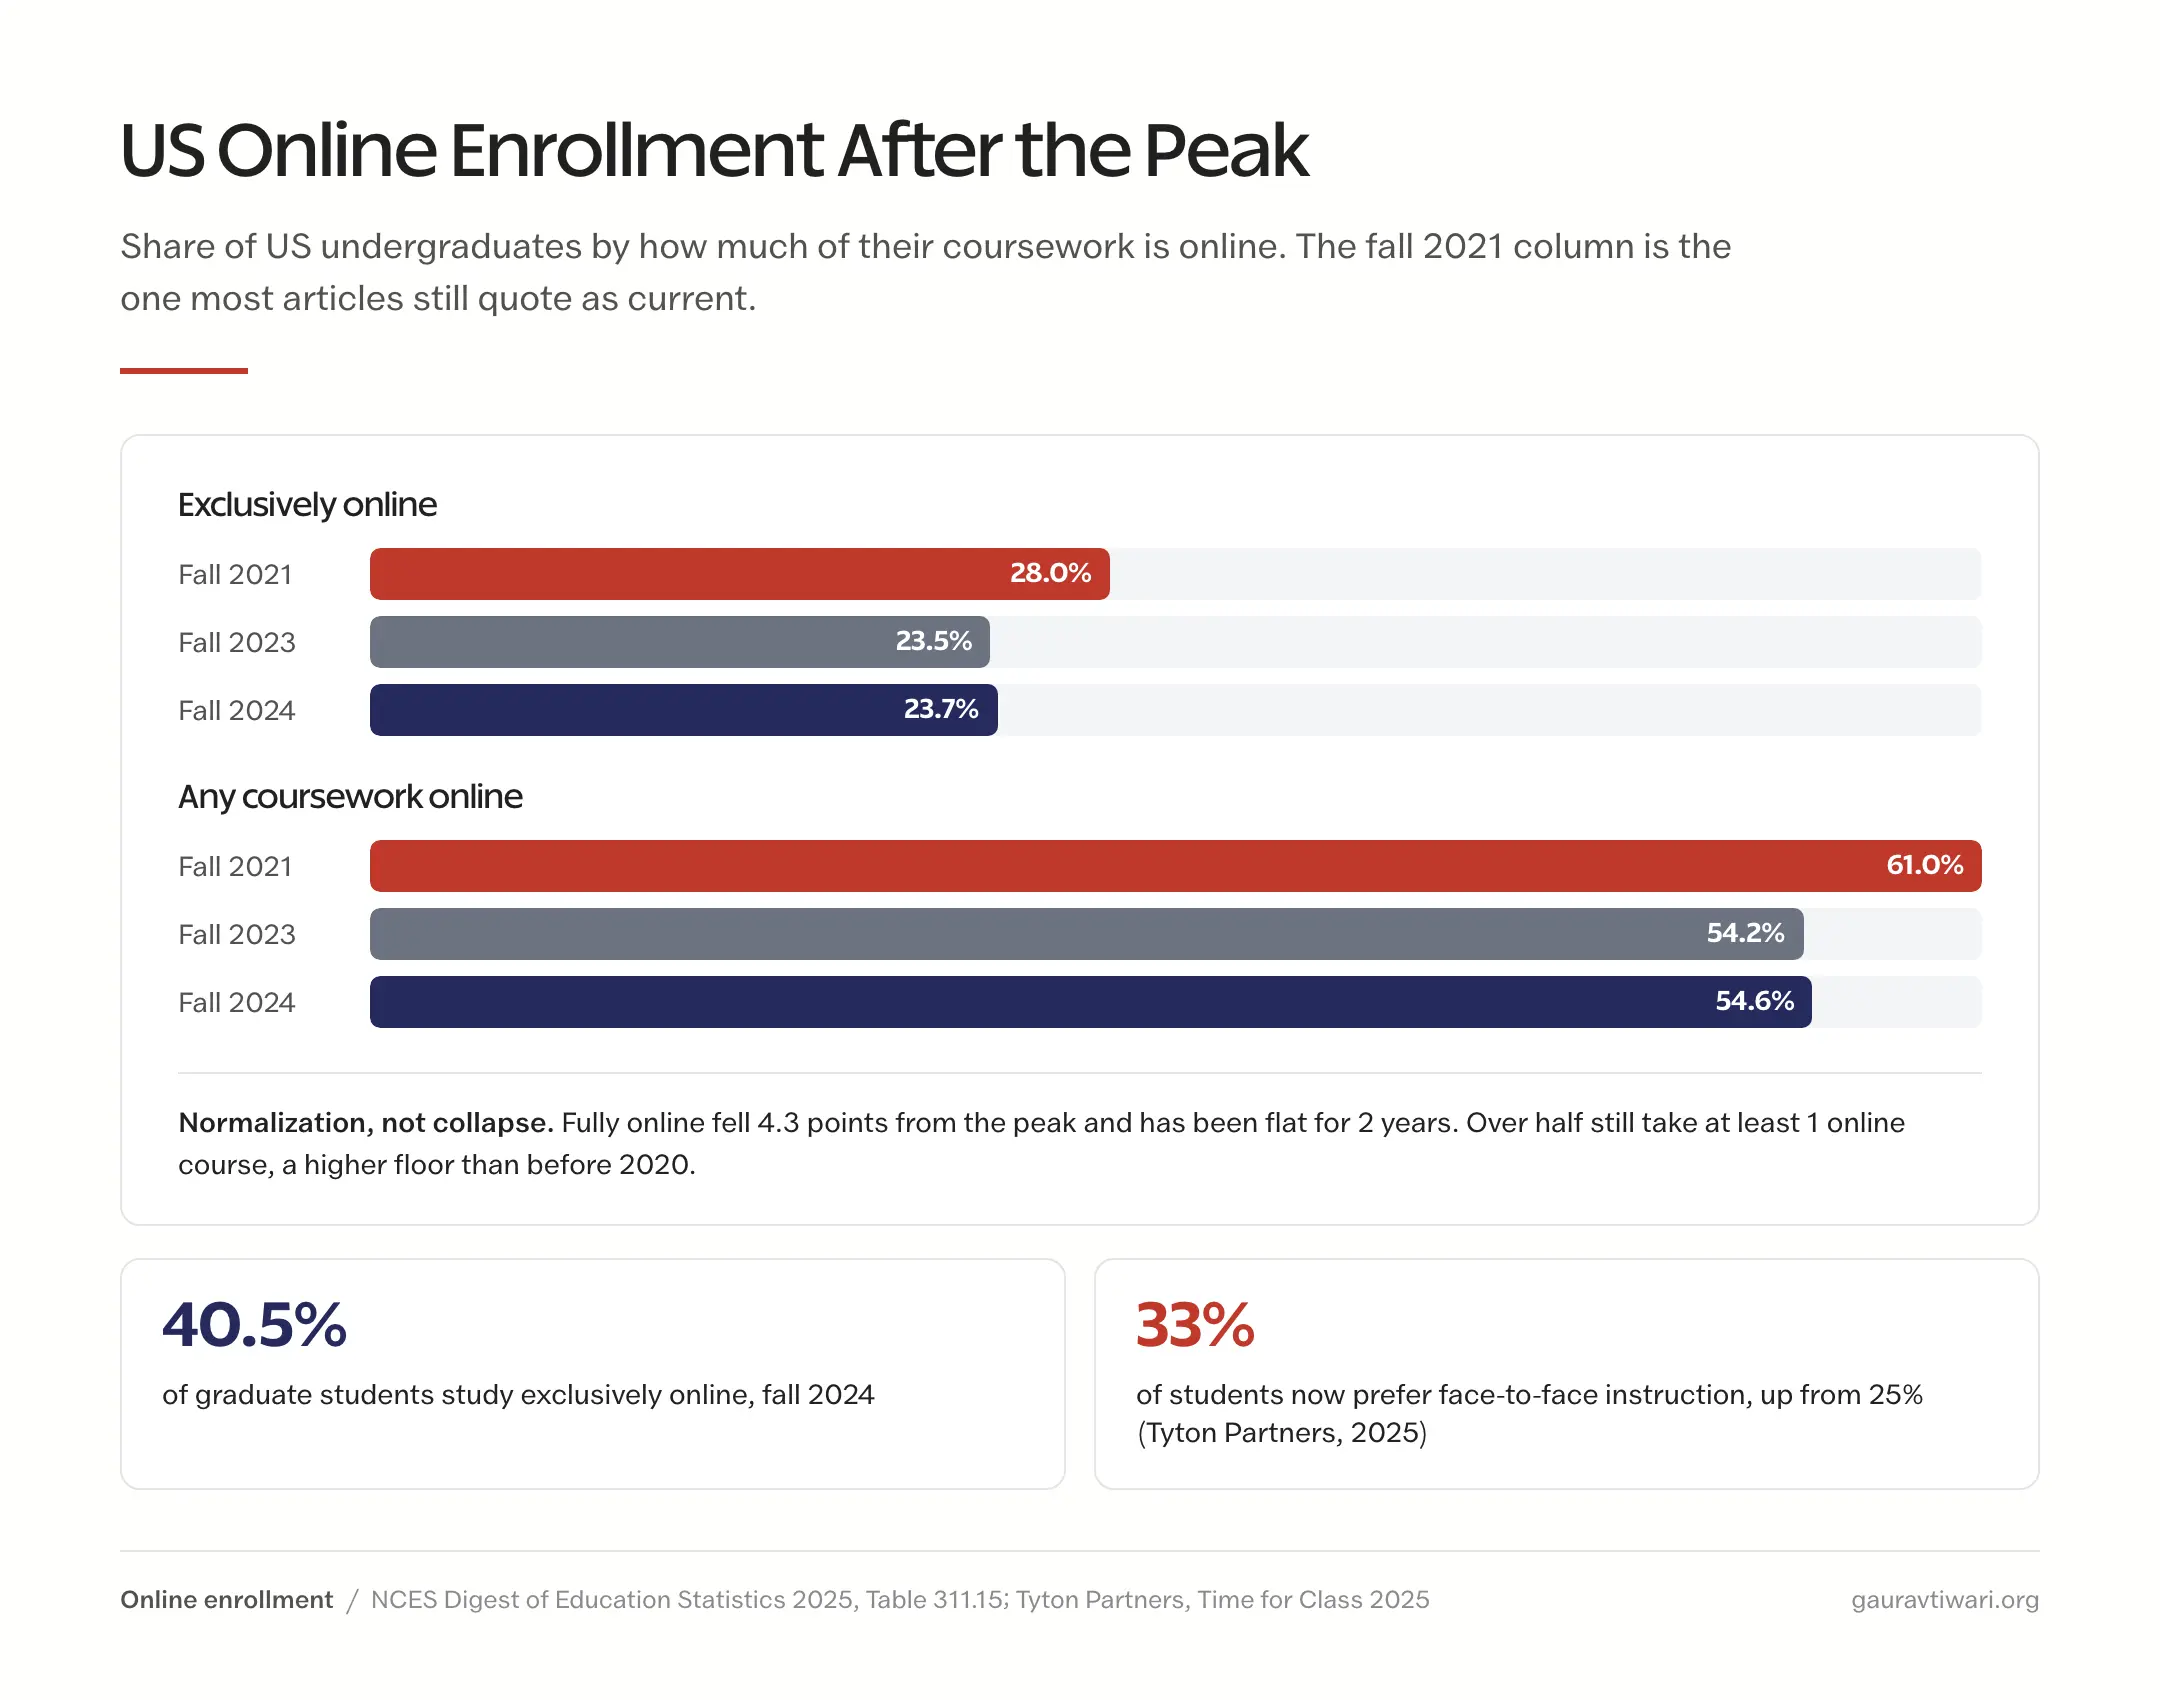
US online enrollment peaked in fall 2021 and has settled since. The National Center for Education Statistics publishes the definitive count, and the most recent data, fall 2024, looks nothing like the pandemic figures most pages still carry.
| US undergraduates | Fall 2021 | Fall 2023 | Fall 2024 |
|---|---|---|---|
| Exclusively online | 28.0% | 23.5% | 23.7% |
| Some courses online | 33.0% | 30.6% | 30.9% |
| Any online | 61.0% | 54.2% | 54.6% |
Fully online undergraduate enrollment fell more than 4 points from the peak and has been flat for 2 years. Among graduate students, 40.5% study exclusively online and 55.3% take at least some courses online. The widely repeated “45% of graduate students are fully online” appears to be a misread of the column for students taking no online courses.
Counting every student rather than undergraduates alone makes the shape clearer. Exclusively online enrollment was 17.6% of all US students in fall 2019, spiked to 46.7% in fall 2020, fell to 30.3% in 2021, bottomed around 26% in 2022, and sat at 26.5% in fall 2024, about 5.2 million of 19.7 million students. The pandemic cohort went home. What stayed behind is a floor roughly 50% higher than before.
Normalization, not collapse. Over half of undergraduates still take at least one online course, which is a permanently higher floor than 2019. But the direction of travel since 2021 is down, and the pages saying online enrollment “isn’t slowing” are reading the wrong year.
- 87.8% of US degree-granting institutions offered distance education courses in 2024, up from 77.1% in 2018 (computed from IPEDS institutional data). The “98%” that circulates has no source
- Total postsecondary enrollment rose 3.2% in spring 2025, about 562,000 students (National Student Clearinghouse)
- 33% of US students now prefer face-to-face instruction, up from 25%, while 29% prefer hybrid (Tyton Partners, Time for Class 2025)
- Among students already enrolled in or considering online programs, 76% rate online as equal to or better than campus learning and 98% would recommend it (BestColleges 2025, n=1,000)
- 564,235 US K-12 students were enrolled in full-time online schools in 2022-23, down 4.2% since 2020 (Digital Learning Collaborative). The “3.5 million” figure in circulation is about 6 times too high
The BestColleges numbers need their caveat attached. A 98% recommendation rate from people who already chose online education is a finding about online students, not about students. It is still useful. It just answers a narrower question than the headline suggests.
Completion Rates
The most quoted completion statistic in online education is 13 years old. Katy Jordan’s 2015 analysis found a 12.6% median completion rate across MOOCs, on data that closed in November 2013. It gets cited as current in almost every roundup, usually attributed to whoever last quoted it.
The best evidence since then says nothing improved. Reich and Ruipérez-Valiente’s 2019 study in Science, covering 6 years of MIT and Harvard MOOC data, found completion rates showed no improvement over the period and that 52% of registrants never started the course at all.
You will read that the completion problem has been “solved” by cohorts, communities, and microlearning, with figures like 85% for cohort courses. Those figures are vendor marketing. One of the most-cited sources for them does not exist as a research body. Paid, structured programs do complete at far higher rates than free open courses, and edX reported 91% completion for its executive education courses in 2022, self-reported. But that is selection, not a solved design problem: people who pay $2,000 for a 6-week program finish it.
Free and open means most people leave. Paid and short means most people stay. The format matters less than the commitment.
Online Learning Platform Statistics
The platform market consolidated in 2026. Coursera’s all-stock acquisition of Udemy, announced in February and closed on 11 May 2026, put the 2 largest open course marketplaces under one roof. Any comparison that treats them as rivals is describing a market that no longer exists.
- Combined: 300 million+ registered learners, 1.6 million+ paid subscribers, 12,000+ enterprise customers (Coursera Q2 2026 shareholder letter)
- Coursera alone had 197 million registered learners at the end of 2025, up 17%, and 205 million by March 2026, after which it retired the metric
- Coursera revenue: $757.5 million for 2025, up 9%; $298.6 million in the second quarter of 2026 alone, up 60% with Udemy included, and about 1% down on a like-for-like basis
- Combined 2026 revenue guidance: $1.22 to $1.245 billion
- Udemy’s final standalone year: $789.8 million in 2025 revenue, flat at 0.4% growth, and its first profitable year with $3.8 million net income
- Udemy at March 2026: 85 million+ learners, 90,000+ instructors, 300,000+ courses, with enterprise customers at 69% of revenue
The like-for-like figure is the one to watch. A 60% jump that is a 1% decline once you strip out the acquisition means the combined company is not growing yet. It bought scale, not momentum.
For instructors, the trend is plainer. Udemy’s payments to course creators peaked at $209.5 million in 2023 and fell to $169.5 million in 2025, a 19% drop, after 3 cuts to the subscription revenue share: 25% to 20% in 2024, 17.5% in 2025, and 15% from 2026. More learners, less money per instructor. If you are deciding where to host a course, that trajectory matters more than any learner count, and the comparison of course platforms weighs marketplace reach against owning your pricing.
Other Platforms
Outside the merged company, the figures that hold up are the ones platforms publish themselves.
- Khan Academy: 227 million registered users and 104.9 million active learners in the 2024-25 school year, across 190+ countries and 55+ languages
- edX: claims 100 million learners and 5,300+ programs from 250+ partners. Its owner 2U filed for Chapter 11 in July 2024, 3 years after buying edX for $800 million, and emerged as a private company. Class Central’s independent count is 86 million
- SWAYAM (India’s government platform): 20,370+ courses and 66 million+ cumulative enrollments, per its own live counters. Enrollments, not unique learners
- LinkedIn Learning: 24,000+ courses. LinkedIn publishes no learner count for it; the “27 million users” figure in circulation has no source
- FutureLearn: about 22 million learners, now owned by Global University Systems after the Open University and SEEK sold out following mounting losses
One source everyone cites for platform totals, Class Central’s annual “MOOCs by the numbers,” stopped publishing after its 2021 edition. A “Class Central 2025 report” does not exist, and figures attributed to one were invented somewhere downstream.
Creator Platforms
Self-hosted course platforms publish cumulative creator earnings, which are impressive and hard to compare, because each one started counting at a different time.
- Kajabi: $12 billion+ earned by its creators, up from a $5 billion milestone announced in March 2023
- Teachable and Hotmart combined: $10 billion+, 200,000+ creators, 100 million+ students, undated
- Thinkific: $4.23 billion cumulative; 2025 gross merchandise value of $460 million, flat on 2024, with company revenue of $73.2 million, up 9%
Thinkific is the only one of the three that is publicly listed, so its numbers are audited, and the one that matters is the flat GMV. Creators on the platform sold the same dollar volume in 2025 as in 2024. Growth in the creator economy is not evenly spread, and the cumulative totals on the other platforms hide whatever their current-year figure is doing. If Kajabi’s pricing is the obstacle, the Kajabi alternatives roundup covers what each one gives up.
Corporate eLearning Statistics
Corporate training spend per head rose 13% in 2025 after 2 years of cuts. Training magazine’s 2025 Training Industry Report, the longest-running survey of US corporate L&D, puts the numbers in one place.
- Total US training expenditure: $102.8 billion, up nearly 5%
- Spend per learner: $874, up from $774 in 2024
- Training hours per employee: 40, down from 47
- Hours delivered online or by computer: 34%, unchanged
- Budget direction for 2025: 41% increased, 43% flat, 16% cut
More money, fewer hours, same online share. Companies are paying more per hour of training rather than delivering more of it, and the online proportion stopped growing 2 years ago. The “corporate training is going all-digital” line has no 2025 data behind it.
The market for the systems that deliver it is growing faster than the spending. Fortune Business Insights sizes the learning management system market at $31.61 billion in 2026, projecting $104 billion by 2034. In North American higher education, Canvas led the last freely published share analysis by a wide margin, 44% by enrollment at year-end 2022, ahead of Blackboard at 21%, D2L Brightspace at 17%, and Moodle at 9%. Newer figures sit behind a paywall, and the market has moved since: Blackboard’s owner Anthology went through Chapter 11 in late 2025 and emerged debt-free in March 2026.
AI in Online Education
Student use of AI went from a minority to near-universal in 2 years, and the evidence on whether it helps them learn is split in a way most coverage skips.
- 95% of UK undergraduates use AI in some part of their studies and 94% for assessed work, up from 92% in 2024 and 66% in 2023 (Higher Education Policy Institute, fieldwork December 2025, n=1,054)
- 88% of students across 35 countries use AI in their studies (Digital Education Council, 2026, n=45,398)
- Asked which sources they lean on, 37% lean toward AI, 29% are balanced, and 33% still lean toward traditional sources (HEPI 2026)
- At California State University, the largest AI contract in higher education, a fall 2025 survey of 94,060 students and staff found 95% had used an AI tool, 53% of students use one consistently, and 65% of students are skeptical that AI benefits their education
- That CSU contract covers about 470,000 students and 63,000 staff at $13 million a year on its 2026 renewal, down from roughly $17 million for the first 18 months
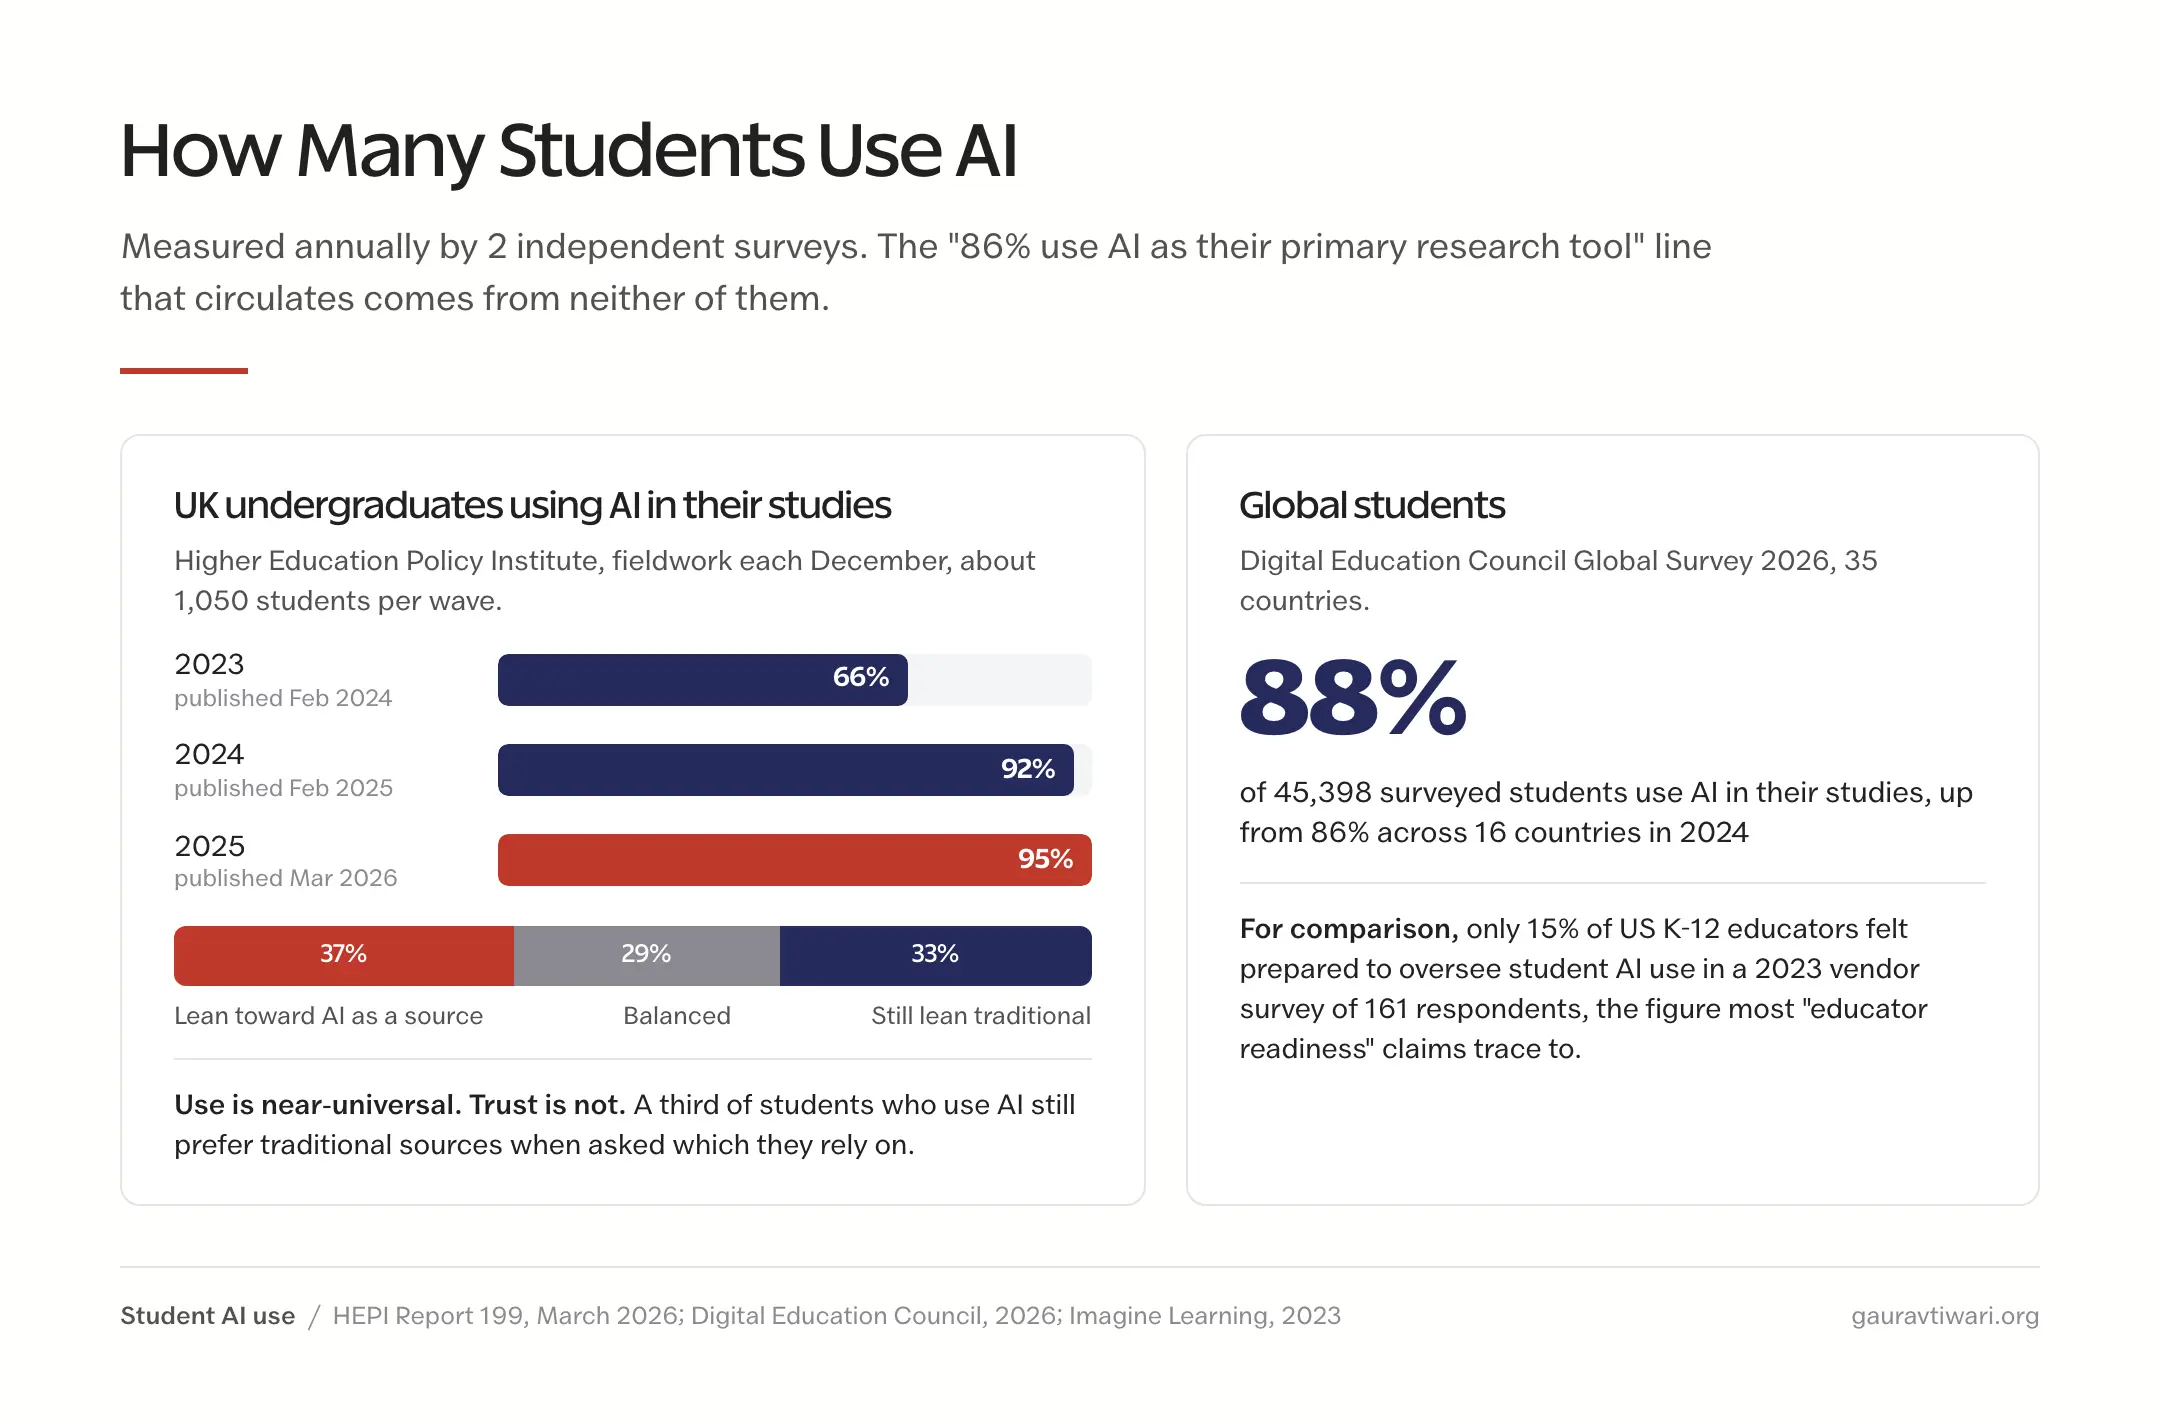
Use is near-universal. Trust is not. A third of students who use AI every week still prefer a textbook when asked which they rely on, and at the university system that bought the most licenses, two-thirds of students doubt the purchase helps them.
The “86% of students use AI as their primary research tool” line you will see elsewhere comes from none of these surveys. It welds a 2024 figure onto an unrelated baseline to manufacture a trend, and no survey has measured “primary.”
Does AI Tutoring Work
Yes under some conditions, and it can make things worse under others. Three randomized trials now exist, and they do not all point the same way.
- Harvard physics, 194 students: an AI tutor built on research-based design beat in-class active learning by 0.63 standard deviations, with students finishing in a median 49 minutes against about 60 (Kestin and colleagues, Scientific Reports, June 2025)
- Nigeria, 9 public schools, 6 weeks: students paired on Microsoft Copilot gained 0.31 standard deviations on a combined assessment, the equivalent of 1.5 to 2 years of ordinary schooling, with the largest gains for girls (World Bank, May 2025)
- Turkey, about 1,000 high school students: unrestricted ChatGPT access raised practice scores 48%, but when access was removed those students scored 17% worse than students who never had it. A guardrailed tutor version raised practice scores 127% with no harm afterward (Bastani and colleagues, PNAS, July 2025)
The third study is the one to keep. The same technology produced the best and worst outcomes depending on whether it was allowed to hand over answers. Anthropic’s own analysis of 574,740 student conversations found about 47% were direct answer-seeking with minimal engagement. The design decides whether the tool teaches or substitutes.
The “students in AI environments score 54% higher” figure that circulates traces to an AI image-generator company’s blog. Use the trials.
What AI Did to Chegg
The clearest measured case of generative AI dismantling an online education business is Chegg, which sold homework help by subscription.
- Revenue: $776.3 million in 2021, $617.6 million in 2024, $376.9 million in 2025, down 39% in a single year
- Second quarter of 2026: $51.8 million, down 51% year on year, with guidance of $43 to $44 million for the next quarter
- Received a New York Stock Exchange notice for a share price under $1 in July 2026 and has pivoted to licensing its content for AI model training
From a $776 million business to a roughly $200 million run rate in 4 years. Chegg’s product was an answer to a question typed into a box. So is ChatGPT’s, and it is free.
Duolingo, often held up as the AI-native counterexample, is still growing but decelerating fast: daily active users rose 23% to 58.7 million in the second quarter of 2026, down from 36% growth 3 quarters earlier, with revenue up 18% to $298.5 million.
Credentials and Workforce Reskilling
The World Economic Forum’s Future of Jobs Report 2025 is the anchor for reskilling statistics, and unlike most of this field, its figures check out line by line.
- Job creation and destruction will amount to 22% of today’s jobs by 2030: 170 million created, 92 million displaced, a net gain of 78 million
- 85% of employers plan to prioritize upskilling; 63% name skill gaps as the biggest barrier to transformation
- Of every 100 workers, 59 will need training by 2030: 29 can be upskilled in their current roles, 19 upskilled and redeployed, and 11 are unlikely to get the training they need
- 50% of the global workforce has completed some training, up from 41% in the 2023 edition
- A June 2026 WEF and PwC follow-up finds 37% of young workers are in occupations with medium to high AI exposure
That 59-in-100 figure usually gets quoted with “only 29 can be upskilled,” which drops the 19 who are retrained and moved. The report’s own picture is that 48 of the 59 do get trained. The problem is the 11, not the 30.
Do Certificates Get People Hired
The supply of credentials has exploded and the evidence that employers act on them has not kept pace.
- 1,850,034 unique credentials exist in the US, including 1.02 million badges and 486,000 certificates, from 134,491 providers (Credential Engine, Counting Credentials 2025). The widely quoted 1.08 million is the 2022 edition
- Coursera’s Professional Certificate enrollments grew 22% in 2025 to 6.0 million, against 10% for course enrollments overall
- Google Career Certificates report 1 million+ graduates worldwide and 350,000+ in the US, with 70%+ of US graduates reporting a positive career outcome within 6 months, self-reported
- Among large employers, 87.4% that track degree modality had hired graduates with online degrees, and all of them paid the same starting salary (National Association of Colleges and Employers, 2024, n=255). That is about degrees, not certificates, and about past hiring, not stated willingness
- Only about 1 in 5 employers were actively seeking entry-level hires with certificates, and they rank online-provider certificates below university ones (NACE Recruiting Benchmarks, 2023, n=334)
The hardest number in this section comes from Burning Glass Institute and Harvard Business School, who tracked 11,300 roles and 65 million workers to see what happened after companies dropped degree requirements. Only 3.6% of roles actually removed one. The net effect on who got hired was 0.14 percentage points, roughly 97,000 workers a year out of 77 million hires. Fewer than 1 in 700.
Set that against the vendor surveys saying 92% of employers would pay more for a micro-credential, and you have the two ends of this market. What employers say in a survey and what they do in a hiring system are different datasets, and only one of them pays salaries.
There is also a gap nobody fills: no 2025 or 2026 source measures micro-credential completion rates. Platforms publish enrollments. Coursera discloses 6 million certificate enrollments and zero completions. If you are choosing a program, the roundup of online courses weighs that absence explicitly.
Online Universities and the OPM Collapse
The companies that built online degree programs for universities, the online program managers, were projected to be an $8.25 billion US industry by 2025 before the pandemic. They reached $3.37 billion, 40.9% of the forecast, according to Validated Insights, the only firm publishing hard numbers on the segment.
- New OPM partnerships: 81 in 2024, down 42%, and 18 in the first half of 2025, down 45% again, levels last seen in 2016
- 2U, the flagship, filed for Chapter 11 in July 2024 with more than $900 million of debt, 3 years after paying $800 million for edX. It emerged private in September 2024, exited boot camps, and cut staff again in August 2026. A $414 million loan facility matures in December 2026
- Pearson sold its online learning unit in 2023 for no upfront payment. Wiley sold its university services arm for $110 million plus earnouts after spending about $540 million building it
- Risepoint, the survivor, runs about 30% of all OPM-managed programs and bought Keypath’s North American business in August 2026. Its partner count still drifted from “over 125” to “100+” in 2 years
Regulation did not do this. The Department of Education reviewed the 2011 rule that allowed revenue-share deals and kept it, then withdrew its own tougher guidance in November 2024. The market collapsed on unit economics: universities stopped signing away half their tuition once they could build programs themselves. Winning a shrinking market is still a shrinking market.
The universities themselves are the opposite story. A handful of institutions now operate at a scale no OPM ever reached.
- Western Governors University: 192,613 students in fiscal 2025, up 9.5%, with 58,625 graduates in the year
- Arizona State: 81,562 online students in fall 2025, 50.9% of its total. A major public research university is now majority online
- Grand Canyon: 113,011 online students as of June 2026, up 7.8%
- University of Phoenix: about 85,300 students, now listed on the NYSE after an October 2025 IPO, following the collapse of its sale to the University of Idaho
- The top 5 institutions hold about 1 in 8 of all exclusively online US students, the top 25 about 1 in 4, and the remaining 60% are spread across some 5,800 others (computed from federal IPEDS data, fall 2023)
Concentration is real and smaller than the mega-university story implies. A quarter of fully online students attend 25 schools. Three-fifths attend somewhere you have never heard of.
Two federal changes taking effect in July 2026 will shape the next numbers. Graduate PLUS loans, the mechanism that financed most expensive online master’s degrees, are eliminated for new enrollment periods, with a lifetime federal borrowing cap of $257,500. And the distance education rule that was widely reported as an attendance-taking mandate was finalized without one; the only surviving provision is enrollment reporting, delayed to 2027.
The Digital Divide
Every online education statistic above describes the connected three-quarters of the world. The International Telecommunication Union’s Facts and Figures 2025 describes the rest.
- 2.2 billion people remain offline, about 26% of the world, down from 2.3 billion in 2024
- Internet use runs from 23% in low-income countries through 63% lower-middle and 88% upper-middle to 94% in high-income countries
- About 52% of primary schools worldwide lack internet access for teaching, improved from 60% in 2021 (UNESCO Institute for Statistics, 2024)
The “2.6 billion offline” figure still quoted everywhere is 2 ITU editions old, and the agency has since revised even the 2024 baseline down. The divide is closing. It is closing at the rate of roughly 100 million people a year, which puts full connectivity 2 decades away.
Online Education Statistics That Are Not True
Online education has a worse zombie-statistic problem than most fields, because a handful of numbers from a single March 2000 investment bank note have been copied between roundups for 26 years. These are the ones you will meet most often.
Online learning has grown 900% since 2000. The trail ends at a 2012 YouTube marketing video. “Oxford College,” the usual attribution, is a private course seller, not the University of Oxford.
Students retain 25 to 60% of material online versus 8 to 10% in classrooms. The 8 to 10% baseline is invented. The original 2000 source gave 58% for classrooms, and “Research Institute of America” was a tax publisher.
People retain 95% of a message from video and 10% from text. A version of the long-debunked “cone of learning.” The company it is attributed to now describes it as a small survey it ran 16 years ago of about 200 B2B buyers.
98% of universities offer online learning. No source. The real figure, computed from federal data, is 87.8% of degree-granting institutions in 2024, up from 77.1% in 2018.
3.5 million US K-12 students attend school fully online. About 6 times too high. The counted figure is 564,235, and it has fallen since 2020.
One college closes every week. The April 2024 Hechinger Report line counted announcements of closures and mergers over 17 weeks. Actual degree-granting closures ran at about 0.6 a week in 2024, 31 for the year, and 15 in 2023.
The pattern is the same each time. A number gets published once with a date and a method, gets quoted without them, then gets quoted from the quote. If a statistic arrives without the year it describes, assume the year is older than you would like.
The Limits of This Data
These numbers are better sourced than most in the field, and they still have edges worth knowing.
- Federal enrollment data lags by about 2 years. Fall 2024 is the newest complete count. Anything claiming fall 2025 online enrollment figures is estimating
- Market sizes are models with different scopes. The 2 times spread between research firms is a definitional difference, not an error, and none of them publishes the data behind the projection
- Platform learner counts are cumulative registrations, not active users, and the largest platform has stopped publishing them at all
- Student surveys skew toward the enrolled. A 98% recommendation rate from online students describes people who already chose online; HEPI’s 95% AI-use figure describes UK undergraduates specifically
- Nobody measures certificate completion. Platforms disclose enrollments only, which means the most-marketed product in online education has no public outcome data
None of that makes the picture unusable. It means the direction of each trend is far more trustworthy than any single decimal, and a statistic quoted to 2 decimal places in this field is a sign the number was never read off a source.
Frequently Asked Questions
How big is the online education market?
The Business Research Company sizes global eLearning at $406.13 billion for 2026, up from $352.59 billion in 2025. Mordor Intelligence puts it at $275.86 billion and Statista’s consumer-only scope at $199 billion, so the answer depends on what counts as eLearning. Each firm draws the boundary differently, and the 2 times spread between them is normal.
What percentage of students take online courses?
In fall 2024, 54.6% of US undergraduates took at least one course online and 23.7% studied exclusively online, according to the National Center for Education Statistics. Among graduate students, 40.5% were fully online. Counting all students, exclusively online enrollment was 26.5%, down from a 46.7% pandemic spike in fall 2020 but about 50% above the 17.6% of 2019.
What is the average completion rate for online courses?
The most cited figure, a 12.6% median for MOOCs, comes from Katy Jordan’s 2015 analysis of data that closed in 2013. A 2019 study in Science covering 6 years of MIT and Harvard courses found no improvement and that 52% of registrants never started. Paid, short programs complete at far higher rates; edX reported 91% for its executive education courses in 2022, self-reported.
Are Coursera and Udemy the same company now?
Yes. Coursera’s all-stock acquisition of Udemy closed on 11 May 2026. The combined company reports more than 300 million registered learners, 1.6 million paid subscribers, and 12,000 enterprise customers, with 2026 revenue guidance of $1.22 to $1.245 billion. Coursera retired its standalone registered-learner metric after reporting 205 million in March 2026.
How many students use AI for their studies?
95% of UK undergraduates use AI in some part of their studies, up from 66% 2 years earlier, according to the Higher Education Policy Institute’s March 2026 survey of 1,054 students. The Digital Education Council’s 2026 survey of 45,398 students across 35 countries found 88%. A third of UK students who use AI still say they lean toward traditional sources.
Does AI tutoring improve learning?
It depends on the design. A Harvard randomized trial of 194 students found an AI tutor beat in-class active learning by 0.63 standard deviations. A trial of about 1,000 Turkish students found unrestricted ChatGPT access raised practice scores but left students 17% worse off once it was removed, while a guardrailed tutor version produced gains with no harm. The tool that hands over answers hurts; the one that withholds them helps.
Are online certificates valued by employers?
Less than vendor surveys suggest. Among large employers that track degree modality, 87.4% had hired graduates with online degrees at the same pay, per NACE 2024. But only about 1 in 5 employers actively sought entry-level hires with certificates, and a Burning Glass Institute and Harvard study of 65 million workers found that dropping degree requirements changed fewer than 1 in 700 hires.
How much do online course creators earn?
No reliable average exists. Platforms publish cumulative totals: Kajabi reports $12 billion+ earned by its creators, Teachable and Hotmart $10 billion+ combined, and Thinkific $4.23 billion, with Thinkific’s audited 2025 creator sales flat at $460 million. On Udemy, total payments to instructors fell from $209.5 million in 2023 to $169.5 million in 2025 after revenue-share cuts to 15%.
Final Remarks
The story in this data is not that online education is winning or losing. It is that the market and the students are moving in different directions at once, and most statistics pages only look at one of them. Money, platforms, and corporate training keep growing. US degree students have settled at a level well above 2019 and well below 2021, and a third of them now say they would rather be in a room.
The AI numbers follow the same split. Use is near-universal. Trust is not, and the best trials say the tool helps or harms depending on whether it is allowed to hand over the answer. A 95% adoption rate tells you nothing about learning until you know which kind of tool the 95% are using.
Online education grew up. It stopped being a trend and became infrastructure, and infrastructure is measured in what it delivers, not in how fast it spreads. Decide which of those 2 things you are trying to buy.
Tell Google you want more of this.
Add Gaurav Tiwari as a preferred sourceOne tap, and this site shows up more often in your own Top Stories, AI Overviews and AI Mode. Remove it any time.