
Search Console is open, the impressions line is climbing, the clicks line isn’t and you can’t tell whether that is good news, bad news or nothing at all. This lesson is about the small number of figures that say whether the work is paying, where each one comes from in 2026 and how to read them without fooling yourself.
Move: Keep. Impressions up and clicks down is the normal shape of 2026, and the metrics that tell you whether the work is paying are the ones that tie a page to money.
Your three actions for this lesson:
- Set up the monthly review sheet
- Split branded from non-branded and track both
- Do the revenue-per-visit math for your top 10 pages
The Metrics That Tie a Page to Money
Not all of the numbers in Search Console and GA4 deserve the same attention. Some tell you what a page is worth and others make you feel busy. The ones worth a monthly look are the ones that connect a page to a reader who did something, and from there to money.
- Organic clicks per page, as a trend. Search Console, Performance, Pages tab, over 3, 6 and 12 months. The direction over those months matters more than the number today.
- Key events per organic landing page. GA4 renamed conversions to key events in March 2024, and a key event is whatever action matters to your blog: an affiliate link click, a newsletter signup, a contact form, a purchase. GA4 reports them by landing page, and you filter the session source to organic.
- Revenue per organic session, or per visit if you’d rather say it that way. Commissions or ad revenue attributable to a page, divided by its organic sessions. This is the number that ranks your pages by what they earn, and it is the one the rest of this lesson builds towards.
- Queries in striking distance. Search Console queries at positions 6 to 20 with real impressions. These are the cheapest growth on the site, and Updating, Merging, and Pruning is where they go.
- Click-through rate against your own pages. A page’s CTR compared with your other pages at a similar position, never against an industry table. More on why below.
Everything else is either an input to one of these or a vanity number, and the vanity numbers get their own section.
Where the Numbers Come From
Before the reading, I want to make sure the sources are straight, because two of the reports changed their names and three of them changed what they count.
In Search Console:
- The Performance report for Search results carries clicks, impressions, CTR and average position, filterable by query, page, country, device and search type, and keeps 16 months of data.
- The Web search type in that report includes AI Overviews and AI Mode. Google’s AI features documentation, updated December 2025, says traffic from AI features is reported in the Performance report under Web, and Google’s Search updates log records AI Mode data counting towards those totals from 16 June 2025. So when someone asks how much traffic AI Overviews send you, the honest answer is that it is inside your Web clicks and Google does not separate it.
- The generative AI performance report, rolled out to every property by 31 August 2026, shows impressions from AI Overviews and AI Mode, by page, country and date. Impressions only. The help page defines an impression as your site’s links being shown to a user in a generative AI feature, and counts two results from the same site in one feature as one impression. There is no clicks column.
- The Page indexing report is the report you may still hear called Coverage. It shows how many URLs are indexed, how many are not and why. The URL Inspection tool is where you check one page.
- The branded queries filter, announced November 2025 and available to all eligible sites by March 2026, splits the Performance report into queries that include your brand name, its misspellings and your product names, and queries that don’t.
- Query groups, added to Search Console Insights in October 2025 for properties with high query volume, cluster the dozens of near-identical queries a page ranks for into one group with its own clicks trend.
In GA4:
- Organic Search as a default channel includes Google’s AI Overviews and AI Mode. Google’s channel documentation says so in the definition.
- AI Assistant is a separate channel for visits from ChatGPT, Gemini, Deepseek, Copilot and Grok, and it excludes Google’s AI features. This is where the small AI referral channel that Using AI Without Tripping the Spam Policies describes shows up.
- Key events are the renamed conversions.
Two things follow from those lists: Search Console is the report for what Google shows and what people click, and GA4 is the report for what they did after arriving. Use each for its half and stop expecting either to match the other’s totals, because they never have.
Impressions Up, Clicks Down
This is the shape most bloggers are looking at in 2026, and it needs explaining before anyone panics over it.
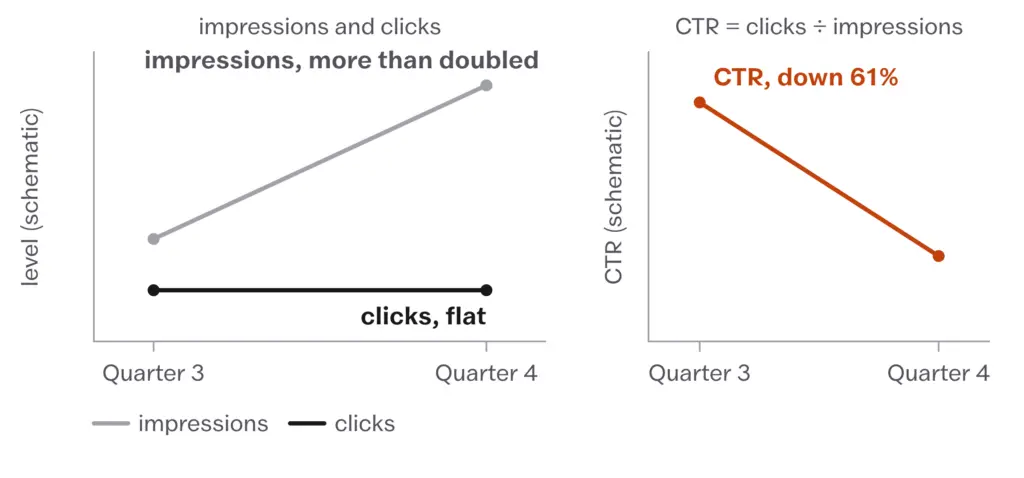
An impression in Search Console is counted when a link to your site is shown. Since AI Overviews and AI Mode went inside the Web totals, a page that gets cited in an AI answer collects an impression every time that answer appears, whether or not anyone clicks. The answer itself has already handled a share of the readers. So impressions rise, clicks stay where they were and the CTR, which is clicks divided by impressions, falls. Nothing about the page got worse.
Seer Interactive’s April 2026 study, which What a Blogger Can Still Win From Search carries in full, shows the shape in numbers. Across 53 brands and 5.47 million queries, the 61% drop in CTR it reported for cited brands between the third and fourth quarters of 2025 came from impressions more than doubling while clicks stayed flat, and a page cited in the Overview still earned about 120% more clicks per impression than one that was not. Pew’s July 2025 panel, in the same lesson, is the other half of the picture: on a search with an AI summary, people clicked a result on 8% of visits against 15% without one. So a falling CTR on an AI-answered query is a change in the denominator, and clicks are the number to watch. On a query that gets an AI answer, roughly half the clicks that used to exist are gone, and your page’s job is to be one of the sources for the half that remain.
A page is judged by its clicks and its key events. Its impressions tell you where it was shown, and nothing more.
The practical reading is this. When impressions rise and clicks hold, look at the generative AI report to confirm the page is being shown in AI features, and treat the page as doing its job. When impressions rise and clicks fall, the page has lost real visits and it goes on the update list. When both fall together, check the dates against the Search Status Dashboard first, as Surviving Updates explains, and only then look at the page.
The Reporting Change to Annotate
There is one date every blogger with a Search Console account needs to annotate before comparing anything across it.
In the second week of September 2025 Google stopped supporting the num=100 parameter, which had let a search results page show 100 results instead of 10. Rank-tracking tools used it to fetch positions, and every such fetch counted as an impression for every site on the page. When the parameter went, so did those impressions.
Search Engine Land, September 2025. In an analysis of 319 Search Console properties published on 18 September 2025, 87.7% of sites lost impressions after the change and 77.6% lost unique ranking terms, while clicks stayed roughly flat and average position improved because fewer queries were being counted from page 3 and beyond. This is a secondary analysis, and Google has not published its own figure. What it means for you: an impressions drop and a position jump in mid-September 2025 were the reporting changing, and any comparison across that date is comparing two different definitions of an impression.
Reading the September 2025 impressions drop as a penalty, or the average position jump as a ranking win. Neither happened to your site. Add a custom annotation for the week of 8 September 2025 and compare periods on the same side of it, or compare clicks, which the change barely touched.
The same care applies to every date in your annotations. A comparison of this month against the same month last year is the most useful comparison in Search Console, and it is worth nothing if you don’t first read the annotations that sit between the two.
Branded and Non-Branded
A search for your name or your blog’s name is a different thing from a search for “best caching plugins,” and until November 2025 you had to separate them yourself with a regex. The branded queries filter now does it, and the split tells you two things the total never could.
Non-branded clicks are the SEO number. They measure whether people who have never heard of you are finding you through search, and they are the number that moves when a page’s ranking moves. Track them by page and by month.
Branded clicks are the audience number. They measure how many people came to Google already looking for you, and they grow when the newsletter, the YouTube channel, the mentions and the books from The Owned Audience are working. A blog whose branded search grows every quarter has something an update can’t take away.
Both belong on the monthly sheet, as separate lines. If the branded filter is not yet showing on your property, Google’s own definition is queries that contain your brand name, a misspelling of it or one of your products, and a regex on your name in the query filter gets you most of the way there.
Query groups, where your property has them, do a similar job for questions: instead of 40 spellings of one question, one group with a trend, and Google’s trending-up and trending-down lists in Search Console Insights are a shortcut to both halves of the update list.
Click-Through Rate Against Your Own Pages
Most guides carry a table of click-through rate by position. I am leaving it out on purpose. Every published CTR table predates AI Overviews, none of them match each other and none of them were measured on your pages, in your niche, with your title links. Since 2024 the same position can sit above an AI answer or below one, and the table has no column for that.
The comparison that still works is inside your own account:
- Performance, Pages, last 3 months, with the position column showing.
- Pick 5 pages with an average position between 3 and 6.
- Write down their CTRs next to each other.
If 4 of them sit near 6% and 1 sits at 1.5%, that page has a title link or a snippet problem, or it is sharing its results page with an AI answer and the others aren’t. Search the query and look. The fix for the first is a rewrite of the title and the first paragraph, following Anatomy of a Page That Ranks and Gets Cited. The fix for the second is to accept the new denominator and make sure the page is one of the cited sources.
CTR is a quarterly number. It moves slowly, and a title rewrite needs a few weeks of impressions before its CTR means anything.
The ROI Arithmetic
SEO is work, and work has a cost, so it is fair to ask what the return is. The formula is simple, and the units are where people go wrong by a factor of a thousand, which is a good reason to walk through it slowly.
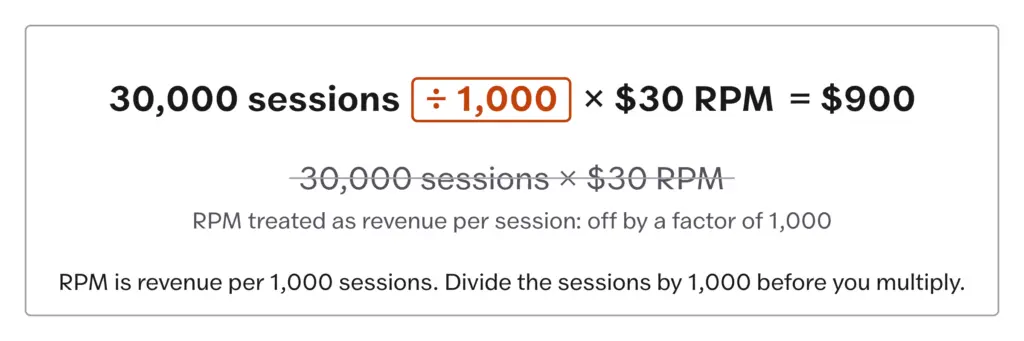
Revenue from organic traffic is whatever your organic sessions earn. For an ad-supported blog that is sessions times RPM, where RPM is revenue per 1,000 sessions. For an affiliate blog it is the commissions that came from organic landing pages. For a services blog it is the value of the leads that arrived through search.
Cost is your time at the rate you would charge someone else for it, plus tools, plus anything you paid for content or images.
Return on that cost is revenue minus cost, divided by cost.
Here is the ad-supported case worked with the units right:
- 30,000 organic sessions in the month
- RPM of $30, meaning $30 for every 1,000 sessions
- revenue = 30,000 / 1,000 x $30 = $900
- cost = 10 hours at $50 plus $140 in tools = $640
- return = ($900 – $640) / $640 = 41% for the month
The trap is writing “$0.03 RPM” when you mean 3 cents a session, and then multiplying as if RPM were revenue per session. $30 per 1,000 sessions is 3 cents per session. 3 cents per 1,000 sessions is 0.003 cents per session. The first earns $900 on 30,000 sessions. The second earns 90 cents.
RPM is revenue per 1,000 sessions. Divide the sessions by 1,000 before you multiply.
Multiplying an RPM by sessions as if it were revenue per session. At a real $0.03 RPM, 200,000 sessions earn $6, not $6,000. Check the units on every revenue figure before it goes in the sheet, and write “per 1,000” next to every RPM.
The affiliate version is easier and more useful. Take your top 10 organic landing pages by clicks. For each, find the commissions it produced in the month, from your affiliate dashboards, and divide by its organic sessions from GA4. That is revenue per visit, per page. A page with 400 visits and $80 in commissions earns 20 cents a visit. A page with 4,000 visits and $40 earns 1 cent. The second page has 10 times the traffic and half the money, and it is the first page that deserves the next update and the next internal links. This is the same arithmetic Keyword Research That Still Pays uses to choose what to write next, applied to what you already have.
The monthly return understates the real one, because the cost of a page is paid once and the page keeps earning. That’s true, and it is also where this arithmetic usually slides into projection, so I’ll leave it at how it works: cost once, revenue for as long as the page ranks, and the ratio improving every month the page survives.
Vanity Metrics
Some numbers feel like progress and predict nothing about traffic or income.
- Domain Authority and Domain Rating. DA is Moz’s metric and DR is Ahrefs’, both on a 0 to 100 scale built from links, and both companies say plainly that their score is not a Google ranking factor. They are a rough proxy for the strength of a link profile, useful for a quick comparison between two sites and useless as a goal. A site with DA 30 can outrank a site with DA 60 for a query, because Google is reading the pages and not the score.
- Page Authority and URL Rating. The same proxies at page level, with the same limit.
- Total keywords ranked for. A site “ranking for 15,000 keywords” may have 14,500 of them past position 50 with no clicks. The count that relates to traffic is queries in positions 1 to 10, and even that is a proxy for clicks.
- Total backlinks. 10,000 links from directories and comment sections are worth less than 50 from sites in your subject that people read. Count referring domains that a reader could name, and read Links and Mentions for what the count should mean.
- Impressions on their own, for the reasons above.
- A plugin’s SEO score. The green light in Rank Math or Yoast measures whether you followed the plugin’s checklist. Google was not consulted.
The test for any metric is whether a change in it changes what you would do next month. If it doesn’t, it doesn’t belong on the sheet.
Trends Over Snapshots
Rankings move every day. A page at position 5 today shows at 7 tomorrow and 4 the day after, and none of that means anything. Google’s SEO Starter Guide, updated December 2025, says some changes take effect in hours and others take months, and suggests waiting a few weeks before judging whether a change helped. The month is the smallest unit that tells the truth.
So the sheet is monthly, one row per month, and it is worth building in a spreadsheet rather than a dashboard, because typing the numbers in makes you look at them. 10 columns are enough:
| Column | Source |
|---|---|
| Organic clicks, total | Search Console, Web |
| Organic clicks, non-branded | Search Console, branded filter off |
| Organic clicks, branded | Search Console, branded filter on |
| Impressions in AI features | Generative AI performance report |
| Key events from organic | GA4, landing pages, organic source |
| Revenue from organic | Ad and affiliate dashboards |
| Revenue per organic session | Revenue divided by GA4 organic sessions |
| Top 5 pages gaining clicks | Search Console, compare with previous month |
| Top 5 pages losing clicks | Search Console, compare with previous month |
| Indexed pages | Page indexing report |
Add a notes column for anything you annotated in Search Console that month, so the row carries its own explanation. 20 minutes a month fills it, and after 6 rows you can see things no single day could show.
When to act and when to wait is the last part, and it is mostly a matter of not touching things.
- A move of 1 to 3 positions day to day is noise, and nothing is done about it.
- A drop in the days after you updated a page is Google re-evaluating the page, and it settles within a few weeks. Do not revert.
- A steady decline across 4 or more weeks on one page is a page problem: something outdated, something a competitor now covers or a results page that changed format. That page goes on the update list.
- A sudden drop across many pages on the same day is a site problem or an update, and it goes to the diagnosis in Surviving Updates before anything is touched.
- A technical fault, such as a page that has dropped out of the index, a robots.txt that now blocks Googlebot or a server that returns errors, gets fixed the same day. The waiting rule applies to rankings. Breakage is fixed the day you find it.
Read a metric across months, never across days, and read every annotation that sits between the two months before you read the difference.
What Doesn’t Work
None of this tells you how much traffic AI Overviews send you. Google reports AI clicks inside the Web totals and reports AI impressions in a separate report with no clicks column, so the number you want is not available from Google, and any tool that claims to give it is estimating. Read impressions in AI features as a sign the page is being used, and read clicks as clicks.
The sheet cannot separate a ranking change from a demand change. A page can hold position 3 and lose half its clicks because fewer people asked the question this month. The compare against the same month last year catches seasonal demand, and a look at the query’s impressions over 16 months catches the rest.
Revenue per visit cannot be computed for a page that earns indirectly, such as a tutorial that brings readers who subscribe and buy something 3 months later. GA4’s attribution reports get part of the way, and the honest answer for most blogs is that those pages are valued by the key events they produce, with a note that the money comes later.
CTR comparisons across your own pages fail when the pages sit on different kinds of results pages. A recipe query with a carousel and a how-to query with an AI answer are not comparable at the same position, so the 5-page comparison only works on pages of the same kind.
Now the habits that quietly make the numbers lie.
Checking rankings every morning. Every day supplies a move of a position or two, every move demands an explanation and no explanation exists, so the morning’s energy goes into a number that will be different tomorrow.
Reporting impressions as growth. The line goes up, whoever you report to is pleased, and the clicks and the revenue have not moved. Three months later the gap is obvious and the impressions line has taught you nothing.
Tracking 500 keywords in a paid tool. The 20 that matter get lost among the 480 that don’t, and the monthly review becomes a scroll instead of a decision.
- The five numbers: organic clicks per page over months, key events from organic landing pages, revenue per organic session, queries at positions 6 to 20, CTR against your own pages at the same position.
- Search Console’s Web totals include AI Overviews and AI Mode. The generative AI report shows impressions only. GA4 puts Google’s AI features in Organic Search and ChatGPT and the rest in AI Assistant.
- Impressions up, clicks flat, CTR down is the 2026 shape of a cited page. Clicks are the judge.
- Annotate the week of 8 September 2025. Never compare impressions or average position across it.
- Branded and non-branded on separate lines. Non-branded is the SEO number, branded is the audience number.
- RPM is per 1,000 sessions. Sessions divided by 1,000, then multiplied by RPM.
- DA, DR, total keywords, total backlinks and plugin scores are not Google’s numbers. A metric earns its column only if a change in it would change what you do.
- Monthly rows, 10 columns, 20 minutes. Wait a few weeks on rankings. Fix breakage the same day.
Open a spreadsheet and make the 10-column sheet above with one row for last month. Fill it from Search Console with the branded filter on and off, from the generative AI report, from GA4’s landing pages with organic as the source and from your affiliate and ad dashboards. Then take your top 10 organic landing pages by clicks and write each one’s revenue per visit next to it. Sort by that column and look at which pages are at the top. Those are the pages the rest of this course’s work should protect first.