Hypothesis Testing Calculator
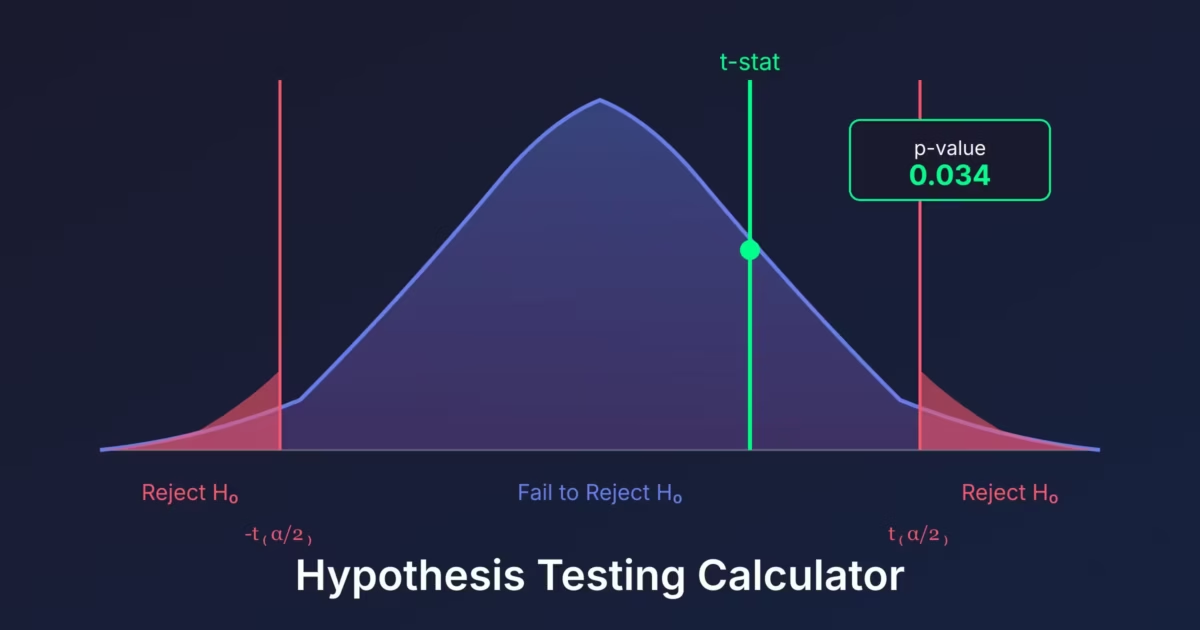
Run a one-sample z-test or t-test. Enter your sample statistics, pick the tail and significance level, and get the test statistic, p-value, critical value, and a plain-English decision.
Test Summary
Interpretation
Calculation Details
A hypothesis test asks one narrow question: is the gap between your sample result and a claimed population value large enough to be hard to explain by random sampling alone? This calculator runs a one-sample z-test when the population standard deviation is known and a one-sample t-test when you estimate variability from the sample.
The number most people watch is the p-value. But a p-value is not the probability that the null hypothesis is true. It measures how unusual your result would be if the null hypothesis and the test assumptions were true. That distinction is small in wording and huge in interpretation.
How to use this calculator
Choose the z-test only when you genuinely know the population standard deviation \(\sigma\). If you have a sample standard deviation \(s\), choose the t-test. The t distribution has heavier tails because estimating variability adds uncertainty, especially when the sample is small.
Enter the sample mean \(\bar{x}\), the hypothesized mean \(\mu_0\), the standard deviation, and sample size \(n\). Then choose a two-tailed test for any difference, a right-tailed test for an increase, or a left-tailed test for a decrease. Pick the direction before looking at the data. Changing tails after seeing the sample makes the stated significance level misleading.
- Write the null and alternative hypotheses in symbols and words.
- Choose z or t from what you know about the population standard deviation.
- Set the significance level, usually \(\alpha=0.05\), before calculating.
- Compare the p-value with \(\alpha\), then report the test statistic, degrees of freedom for a t-test, and practical context.
Worked example
Suppose a filling machine claims to dispense 500 ml on average. A random sample of 25 bottles has a mean of 496 ml and a sample standard deviation of 10 ml. Because the population standard deviation is unknown, use a one-sample t-test with \(H_0: \mu=500\) and \(H_a: \mu\ne500\).
The standard error is \(10/\sqrt{25}=2\). The test statistic is \(t=(496-500)/2=-2\), with 24 degrees of freedom. The calculator obtains the two-tailed p-value from the t distribution. If that p-value is below 0.05, reject the null at the 5% level. If it is above 0.05, report that the sample did not provide enough evidence of a difference. Do not write that the machine was proved accurate.
How to read the result
A small p-value says the observed test statistic sits far into the relevant tail of the null distribution. It does not tell you whether the difference matters. A change of 0.2 units can become statistically significant with a huge sample and still be useless in practice. Report the observed difference and a confidence interval beside the test.
For the matching two-sided test, a 95% confidence interval that excludes the null value corresponds to rejection at \(\alpha=0.05\). NIST explains this test-interval relationship in its Engineering Statistics Handbook. The interval adds information the binary reject or fail-to-reject decision cannot show: direction, plausible size, and precision.
Common mistakes to avoid
- Writing “accept the null.” The safer conclusion is “fail to reject,” because weak evidence can come from a small or noisy sample.
- Treating 0.05 as a law. Alpha is a decision threshold chosen for the cost of false positives, not a universal border between truth and falsehood.
- Ignoring independence, sampling bias, extreme outliers, or strong non-normality in a small sample.
- Running many tests and reporting only the smallest p-value. Multiple testing raises the chance of at least one false positive.
How to verify the result
Check the standardized statistic directly: observed estimate minus null value, divided by its standard error. Its sign must match the direction of the observed difference. For a two-sided test, the p-value accounts for equally extreme outcomes in both tails.
Compare the p-value with the alpha chosen before inspecting the result. Report the test statistic, degrees of freedom when applicable, p-value, observed effect, and a confidence interval. A small p-value is evidence against the null model, not a measure of practical importance.
Test statistics and p-values have no physical unit, but the effect estimate and confidence interval retain the outcome’s unit. Round enough to reproduce the decision without presenting more precision than the sample supports.
Limits of the calculation
This calculator covers a one-sample mean. Use a paired t-test for before-and-after measurements on the same subjects, a two-sample test for two independent groups, a proportion test for counts of successes, and ANOVA when comparing more than two means. The data structure decides the test.
A calculation cannot rescue a biased sample. If the sampling method systematically misses part of the population, a precise p-value describes the biased data precisely. Check how the observations were collected before trusting the last decimal place.
Related calculators
Use Confidence Interval Calculator, Normal Distribution Calculator, Z Score Calculator when the next part of the problem needs a different method.
Useful statistics books and tools
For hypothesis testing, concentrate on assumptions, effect size, Type I and Type II errors, and power before interpreting the p-value. A calculator can handle the arithmetic, but it cannot choose a sound statistical method or explain what the result means.
- Build the concept: Browse statistics textbooks and workbooks on Amazon. Look for worked examples, exercises, and coverage of sampling assumptions.
- Check arithmetic offline: Browse scientific calculators on Amazon. A physical calculator is useful for exams and hand checks, but confirm what models your course permits.
As an Amazon Associate, I earn from qualifying purchases.
Frequently asked questions
What does p < 0.05 mean?
It means the observed result, or one more extreme, would occur less than 5% of the time under the null model. It does not mean there is a 95% probability that the alternative hypothesis is true.
Should I use a z-test or t-test?
Use z when the population standard deviation is known. Use t when you estimate the standard deviation from the sample. In most practical one-sample problems, t is the better choice.
What is a Type I error?
A Type I error is rejecting a true null hypothesis. Its long-run rate is controlled by alpha when the test assumptions and procedure are followed.
Does statistical significance prove practical importance?
No. Practical importance depends on the size of the effect and its consequences. Report the difference and a confidence interval, not only the p-value.
Can I choose a one-tailed test after seeing the result?
No. Choose the direction before inspecting the result. Switching tails afterward understates the false-positive risk.