Confidence Interval Calculator
Calculate confidence intervals for means and proportions.
Confidence Interval
Interpretation
Formula Used
What is a Confidence Interval?
A confidence interval provides a range of plausible values for an unknown population parameter based on sample data. Instead of giving a single estimate, it quantifies the uncertainty in your estimate.
The interval has the form: point estimate ± margin of error
Confidence Level
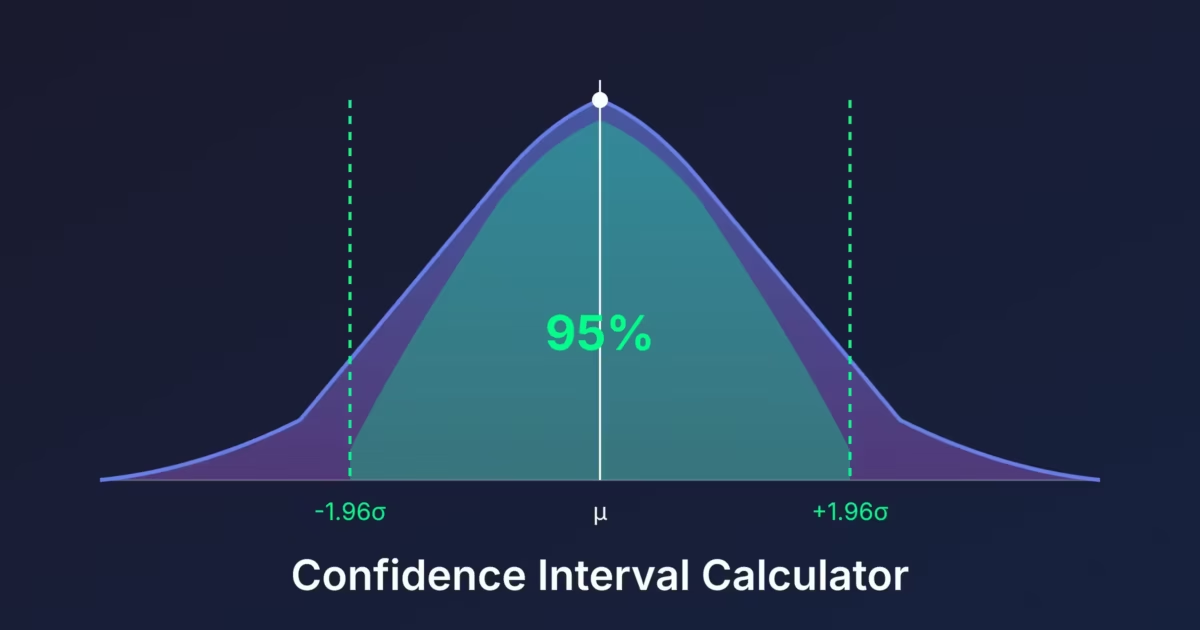
The confidence level (commonly 90%, 95%, or 99%) represents how often the interval would contain the true parameter if we repeated the sampling process many times.
A 95% confidence interval does NOT mean there’s a 95% probability the parameter is in the interval. It means 95% of similarly constructed intervals would contain the parameter.
Types of Confidence Intervals
Z-Interval (\( \sigma \) known)
When the population standard deviation is known:
$$ \bar{x} \pm z^* \cdot \frac{\sigma}{\sqrt{n}} $$
T-Interval (\( \sigma \) unknown)
When using the sample standard deviation:
$$\bar{x} \pm t^* \cdot \frac{s}{\sqrt{n}}$$
The t-distribution has heavier tails, giving wider intervals to account for the extra uncertainty.
Proportion Interval
For estimating population proportions:
$$\hat{p} \pm z^* \cdot \sqrt{\frac{\hat{p}(1-\hat{p})}{n}}$$
Critical Values
| Confidence | \( z^* \) | \( t^* \) \(df=29\) |
|---|---|---|
| 90% | 1.645 | 1.699 |
| 95% | 1.960 | 2.045 |
| 99% | 2.576 | 2.756 |
Factors Affecting Interval Width
Sample Size
Larger samples give narrower intervals (\( \sqrt{n} \) in the denominator).
Confidence Level
Higher confidence requires wider intervals.
Variability
More variable data gives wider intervals.
Interpreting the Interval
- Correct: “We are 95% confident that the true population mean is between 45 and 55.”
- Incorrect: “There is a 95% probability that the population mean is between 45 and 55.”
The parameter is fixed (not random). The interval either contains it or doesn’t.
Sample Size Determination
To achieve a desired margin of error ( E ):
$$n = \left( \frac{z^* \cdot \sigma}{E} \right)^2$$
Double the precision requires four times the sample size.
Assumptions
For Mean Intervals
- Random sample
- Normal population OR large sample (\( n \geq 30 \))
- For t-interval: no extreme outliers
For Proportion Intervals
- Random sample
- \( np \geq 10 \) and \( n(1-p) \geq 10 \) (success/failure condition)
A confidence interval combines an estimate with its sampling uncertainty. The center tells you what the sample suggests; the margin of error tells you how much that estimate would move across repeated samples.
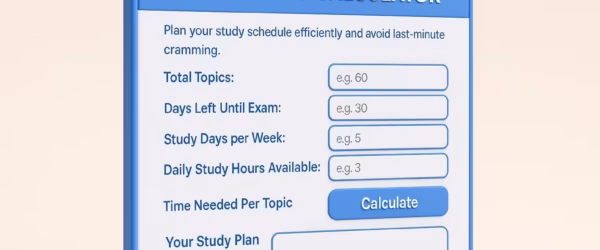
How to use this calculator
Choose a mean or proportion interval, then decide whether the population standard deviation is genuinely known. Use a t interval when you estimate the standard deviation from the sample.
Enter the sample statistic, variability, sample size, and confidence level. A higher confidence level widens the interval because covering the true parameter more often requires a broader net.
- Identify the population parameter and a suitable sampling method.
- Choose z, t, or a proportion procedure from the data type and assumptions.
- Calculate the standard error and multiply by the critical value.
- Report the interval in context, including units and the population being estimated.
Worked example
A sample of 64 observations has mean 50 and known standard deviation 8. For a 95% z interval, the standard error is \(8/\sqrt{64}=1\). The margin is \(1.96\), so the interval is 48.04 to 51.96.
The correct interpretation is about the method: across repeated random samples, about 95% of intervals built this way would contain the population mean. It is not a 95% probability statement about the fixed mean after the data are observed.
How to read the result
Interval width shrinks with the square root of sample size. To halve the margin of error while keeping variability and confidence fixed, you need four times the sample size.
For a two-sided test, a 95% interval that excludes the null value corresponds to rejection at the 5% level. The interval is usually more informative because it displays plausible effect sizes instead of only a decision.
Common mistakes to avoid
- Using z merely because the sample exceeds 30 without checking the procedure and assumptions.
- Treating observations from a convenience sample as though random-sampling uncertainty were the only bias.
- Saying 95% of the population lies inside an interval for the mean.
- Reporting many decimal places when the measurements are coarse.
How to verify the result
Recalculate the margin of error separately: critical value multiplied by standard error. The reported lower and upper limits should be the estimate minus and plus that same margin. Their midpoint must return the sample estimate.
A confidence interval for a mean has the same unit as the measurements. The standard error shrinks with \(\sqrt{n}\), so doubling the sample size does not halve the interval width. You need roughly four times as many independent observations for half the margin of error.
Do not read a 95% interval as a range containing 95% of individual observations. It estimates a population parameter. Sampling bias, dependence, and severe outliers can invalidate a mathematically neat interval before rounding becomes relevant.
Limits of the calculation
Small samples with strong skew or outliers can make standard mean intervals unreliable. Consider a justified transformation, robust method, or bootstrap procedure.
For proportions near 0 or 1, the basic Wald interval can perform poorly. Wilson or exact methods are often better, especially with small samples.
Related calculators
Use Hypothesis Testing Calculator, Normal Distribution Calculator, Z Score Calculator when the next part of the problem needs a different method.
Useful statistics books and tools
For confidence intervals, practice choosing the correct critical value and explaining the interval in terms of the population parameter. A calculator can handle the arithmetic, but it cannot choose a sound statistical method or explain what the result means.
- Build the concept: Browse statistics textbooks and workbooks on Amazon. Look for worked examples, exercises, and coverage of sampling assumptions.
- Check arithmetic offline: Browse scientific calculators on Amazon. A physical calculator is useful for exams and hand checks, but confirm what models your course permits.
As an Amazon Associate, I earn from qualifying purchases.
Frequently Asked Questions
What is a confidence interval?
A confidence interval is a range of values that’s likely to contain the true population parameter. A 95% confidence interval means that if you repeated the sampling 100 times, about 95 of the resulting intervals would contain the true value.
What’s the formula for a confidence interval for the mean?
CI = x̄ ± z_(α/2) · (σ / √n) when the population standard deviation σ is known, or x̄ ± t_(α/2, n-1) · (s / √n) when only the sample standard deviation s is available.
When do I use z vs t distribution?
Use z when σ is known or n ≥ 30. Use t when σ is unknown and n < 30. The t-distribution has heavier tails to account for extra uncertainty from estimating σ from a small sample.
What does a 95% confidence level actually mean?
It refers to the long-run frequency of intervals containing the true parameter, not the probability that any single interval contains it. Once you’ve computed the interval, the parameter is either in it or not — it’s not random.
How does sample size affect the interval width?
Width shrinks as 1/√n. Quadrupling your sample size halves the margin of error. This is why doubling sample size has diminishing returns past a point.
Can I compute a confidence interval for a proportion?
Yes. The formula is p̂ ± z_(α/2) · √(p̂(1−p̂)/n). The calculator switches between mean and proportion modes — pick the one that matches your data.
What’s the relationship between CI and hypothesis testing?
If a 95% CI excludes the null value, the corresponding two-tailed test rejects at α = 0.05. CIs convey effect size and uncertainty in one shot — they’re more informative than a bare p-value.
Why do common confidence levels stop at 99%?
Higher levels (99.9%, 99.99%) require dramatically wider intervals for marginal gains in coverage probability. 90/95/99 covers most practical decisions; beyond that, the interval becomes too wide to be useful.