Complete Google Search Console Setup Guide
Google Search Console is the single most underused free tool in SEO. Every website owner has access to it, but most people glance at it once a month and never dig deeper than the top-level numbers. That’s leaving money on the table. GSC tells you exactly which keywords bring traffic, which pages are dropping in rankings, which technical issues are blocking your growth, and where your biggest opportunities are hiding. Setup takes 10 minutes. Learning to use it properly takes this guide.
What is Google Search Console?
Google Search Console (formerly Google Webmaster Tools) is a free platform that shows you exactly how Google sees your website. Unlike third-party tools that estimate your rankings based on sampled data, Search Console provides actual data directly from Google. Real impressions. Real clicks. Real position data.
Think of it as a direct line to Google. You can see crawl errors before they hurt your rankings, submit new content for indexing, understand which pages drive organic traffic, and get alerts when something breaks. It’s the foundation of any SEO-friendly website strategy.
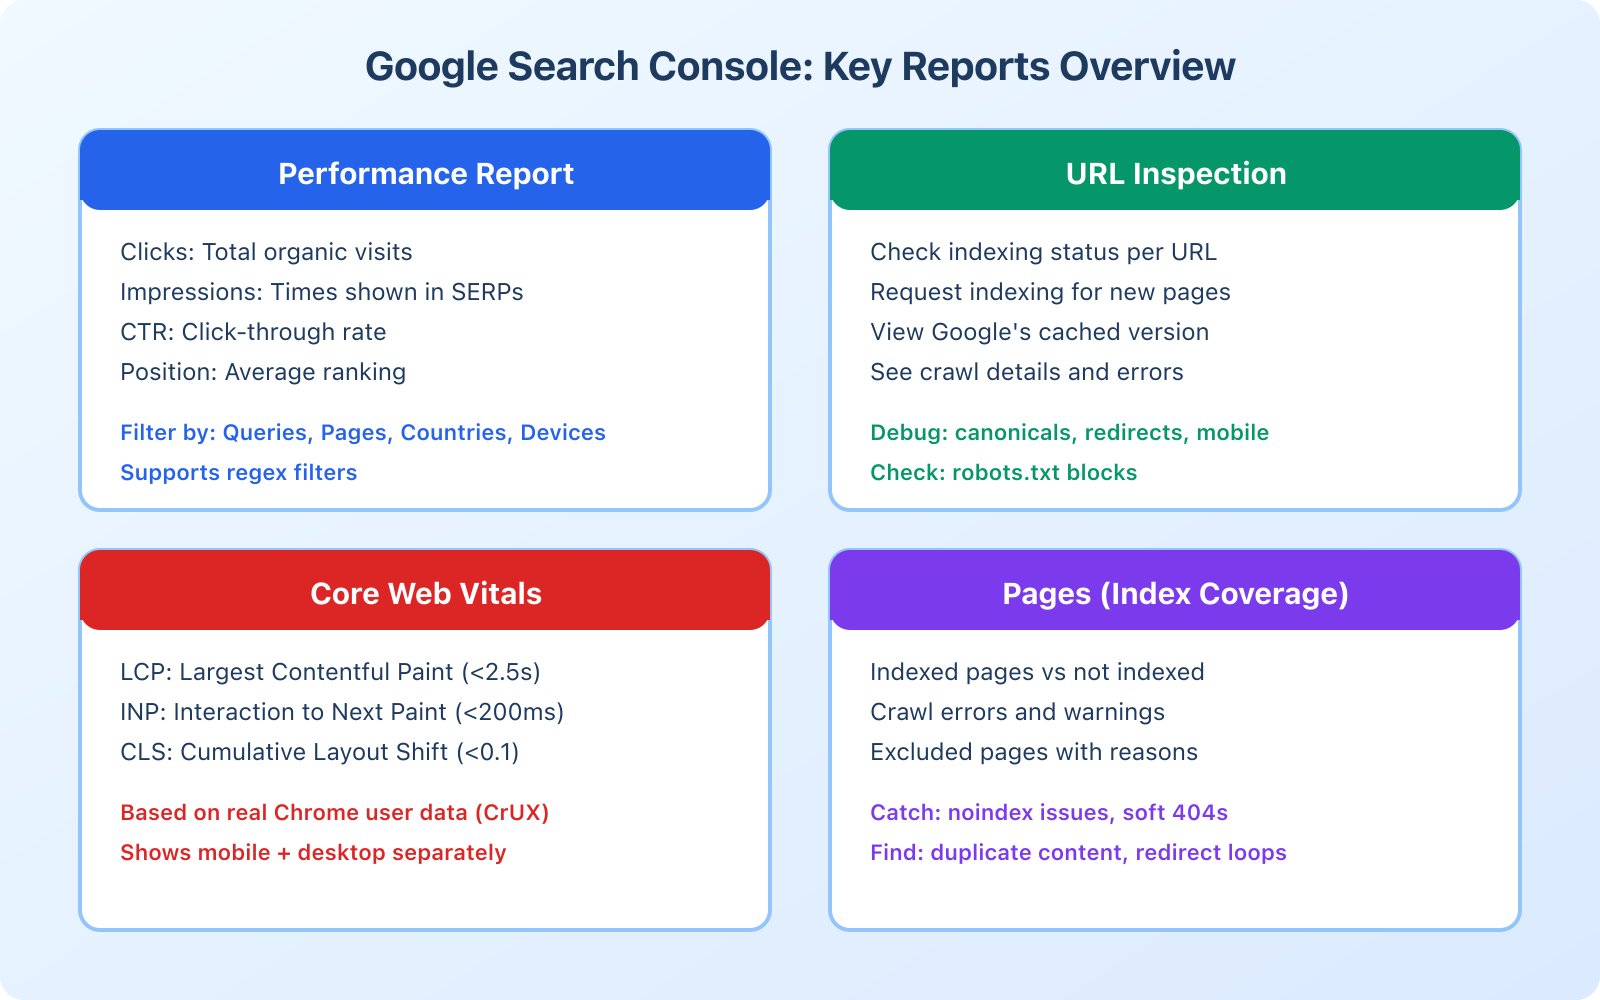
What you can see inside GSC:
- Search terms that trigger your site in Google results (actual keyword data, not estimates)
- Your average ranking position for each keyword
- Click-through rates showing how compelling your titles and descriptions are
- Which sites link to you
- Mobile usability issues
- Core Web Vitals performance
- Indexing status for every page on your site
- Security issues and manual actions
How to Set Up Google Search Console
Before you can access any data, you need to prove you own (or manage) the website. Google calls this “verification.” The whole process takes about 10 minutes, even with manual DNS verification.
Step 1: Sign in to Google
Go to search.google.com/search-console and sign in with your Google account. If you don’t have one, create it first at Google.com. Click “Start now” to open the setup page.
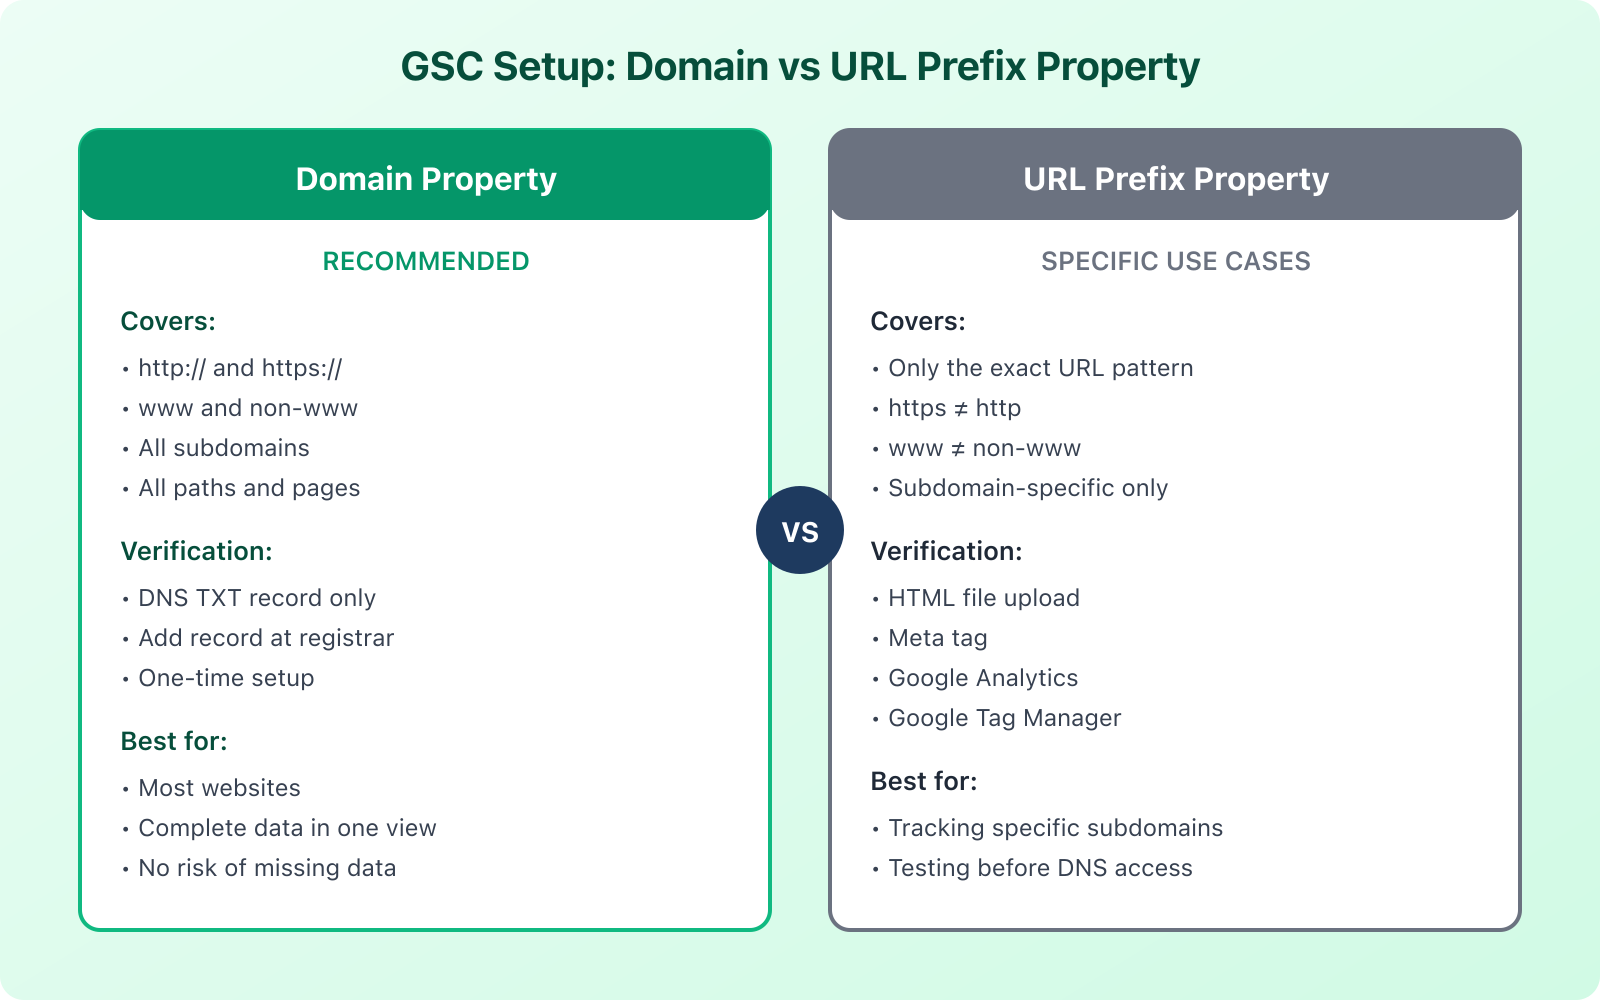
Step 2: Choose Your Property Type
Google gives you two options:
Domain property: Covers your entire domain including all subdomains, protocols (http/https), and www/non-www versions. This is what I recommend for most sites. Enter just the domain (example.com) without any protocol.
URL prefix: Only covers that exact URL pattern. If you add https://example.com, it won’t include http://example.com or https://www.example.com. You’d need to add each variation separately. Use this only if you need to track a specific subdomain or section independently.
For most websites, go with Domain. It captures everything in one place and you won’t miss data from URL variations.
Step 3: Verify Your Site
DNS Verification (Domain Property): If you chose Domain property, DNS verification is your only option. Google gives you a TXT record to add to your domain’s DNS settings. Copy the TXT record, log into your domain registrar (Cloudflare, Namecheap, GoDaddy, etc.), add the TXT record to your DNS settings, wait a few minutes for propagation, then return to Search Console and click Verify.
HTML File Upload (URL Prefix): Download the HTML file Google provides, upload it to your site’s root folder via FTP or your hosting file manager, and click Verify.
HTML Meta Tag (URL Prefix): Copy the meta tag Google provides and paste it into your site’s <head> section. If you use WordPress with Rank Math, there’s a dedicated field for this in the General Settings > Webmaster Tools section.
Google Analytics (URL Prefix): If GA is already installed with the same Google account, Search Console can verify through that automatically. This is the fastest method if Analytics is already running.
If you use Cloudflare as your DNS provider, they have a one-click integration with Google Search Console. You don’t even need to manually add the TXT record. Log into Cloudflare, go to your domain’s DNS settings, and look for the “Verify” option next to Google verification.
Step 4: Submit Your Sitemap
A sitemap tells Google which pages exist on your site and helps ensure everything gets crawled properly. Most WordPress SEO plugins (Rank Math, Yoast, etc.) generate sitemaps automatically.
Your sitemap URL is usually yoursite.com/sitemap_index.xml or yoursite.com/sitemap.xml. To submit it, click “Sitemaps” in the left sidebar, enter your sitemap URL, and click Submit. That’s it.
Step 5: Connect to Google Analytics
This step is optional but useful. Connecting the two accounts lets you see Search Console data directly in your Analytics reports. Open Google Analytics, go to Admin, select your property, find the Search Console section in property settings, and link your Search Console property.
Understanding the Performance Report
Data starts appearing within a few days of verification. The Performance report is where you’ll spend most of your time in GSC, and it’s the most actionable report available for free anywhere in SEO.
The Four Key Metrics
Impressions: How many times your pages appeared in search results. High impressions with low clicks means your titles or meta descriptions need work. You’re showing up, but people aren’t interested enough to click.
Clicks: Actual visits from search results. This is your organic traffic from Google, unfiltered and accurate.
CTR (Click-Through Rate): Clicks divided by impressions. A 3-5% CTR is typical for most positions. Higher means your listing is compelling. Lower means you’re visible but not enticing people to click.
Average Position: Where you rank on average. Position 1-3 is the sweet spot. Position 4-10 is page 1 but below the fold. Position 10+ means page 2, where click-through rates drop to nearly zero.
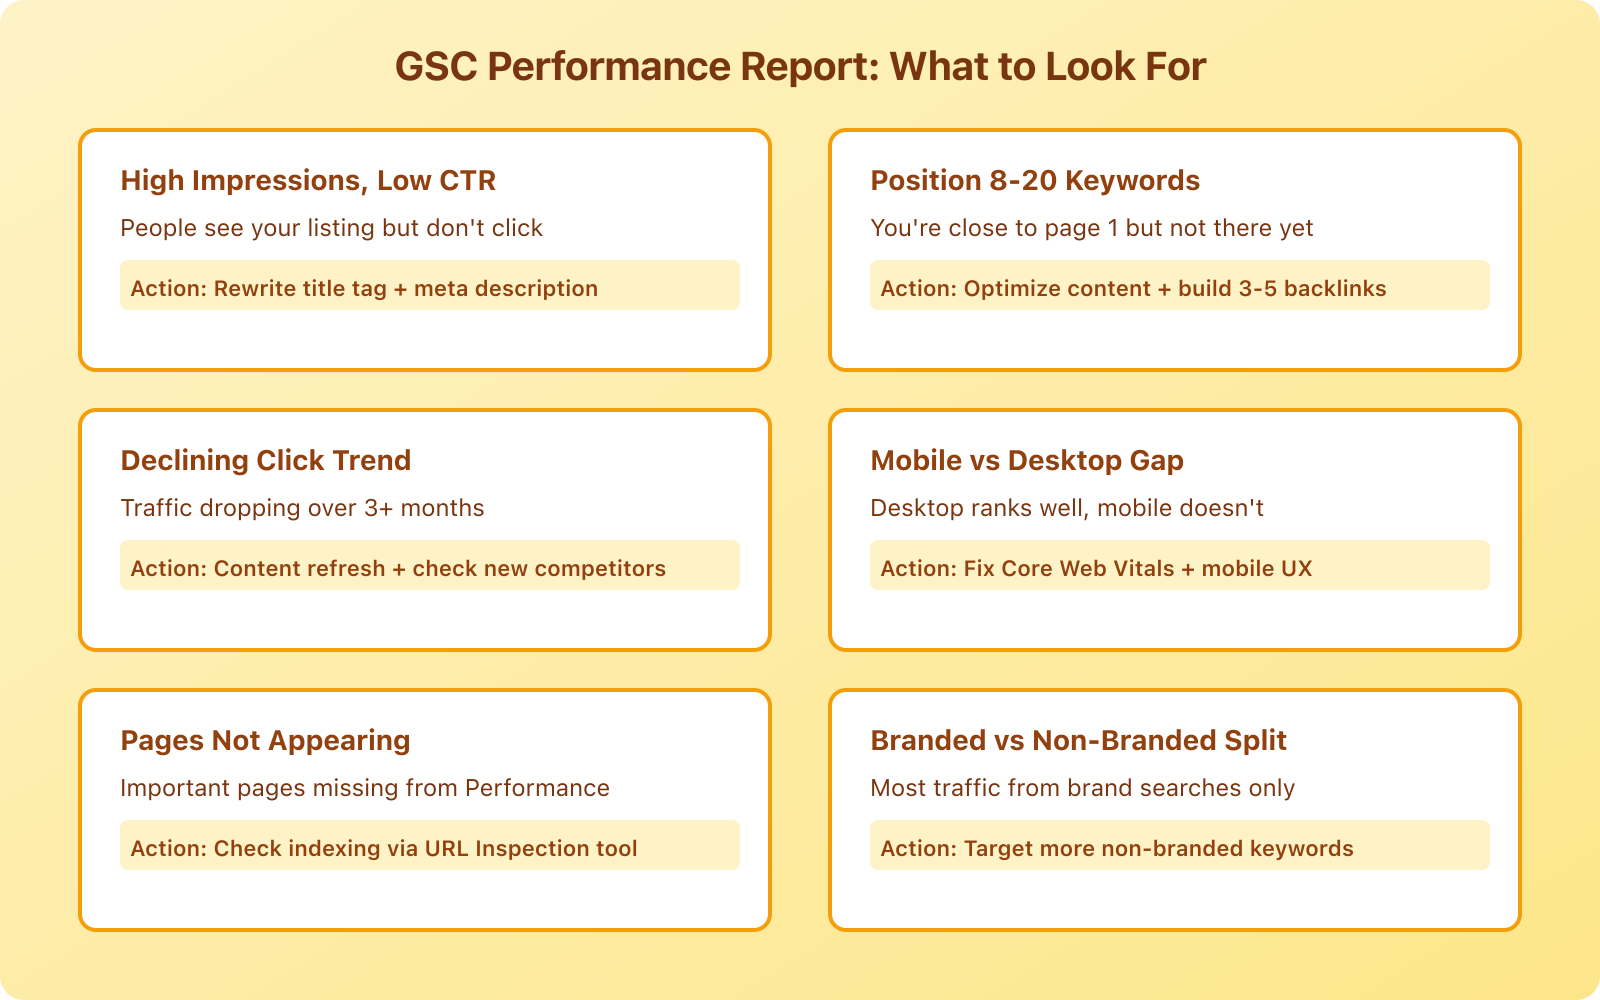
How to Find Your Biggest Opportunities
The Performance report has a filter bar at the top, a chart showing trends, and a table breaking down data by queries, pages, countries, or devices. Here’s what to look for:
High impressions, low CTR: Your page ranks but people aren’t clicking. Rewrite your title tag and meta description to be more compelling. Add numbers, brackets, or power words. A title change can increase CTR by 20-30%.
Position 8-20 keywords: These are your low-hanging fruit. You’re already ranking on the border of page 1. A little optimization (adding a few hundred words, improving internal links, building 3-5 backlinks) could push them onto page 1 where they’ll actually get clicks.
Declining click trends: Compare the last 3 months to the previous 3 months. Pages with declining clicks need attention: either the content is getting stale, or competitors have published better versions.
Branded vs. non-branded queries: Filter by queries containing your brand name. If most of your traffic comes from branded searches, you’re not capturing new audiences through topical content. Time to invest in content targeting non-branded keywords.
Using Regex Filters for Advanced Analysis
One of the most powerful (and underused) features in GSC is regex filtering. In the Performance report, click the “+” filter button, choose “Query,” and select “Custom (regex).”
Some examples that save me hours:
best|top|reviewto find all commercial-intent querieshow to|guide|tutorialto isolate informational queries^(?!.*yourbrand)to exclude branded queriesvs|versus|comparisonto find comparison-intent queries
Regex lets you segment your data in ways that basic filters can’t. If you’ve never used it, start with the simple pipe (|) operator for “OR” matching. It’s the 80/20 of regex that gets you most of the value.
The URL Inspection Tool
The URL Inspection tool shows you exactly how Google sees a specific page on your site. Type any URL from your site into the search bar at the top of GSC and you’ll see:
- Whether the page is indexed
- Which canonical URL Google selected (it might not be the one you set)
- When it was last crawled
- Whether it’s mobile-friendly
- Any crawling or indexing issues
You can also request indexing for new or updated pages. After publishing a new article or making significant updates, paste the URL here and click “Request Indexing.” Google typically picks it up within hours, much faster than waiting for natural crawling.
I use this tool after every article update to make sure Google re-crawls the page with the new content. It’s especially important after content audits when you’re updating multiple pages.
Core Web Vitals in Search Console
Google uses Core Web Vitals as a ranking factor. The Core Web Vitals report in GSC shows you how real users experience your site, using data from the Chrome User Experience Report (CrUX).
The three metrics that matter:
LCP (Largest Contentful Paint): How quickly the main content loads. Target: under 2.5 seconds. This is usually the hero image or the largest text block on the page.
INP (Interaction to Next Paint): How quickly the page responds when users interact with it (clicking buttons, typing in forms). Target: under 200 milliseconds. This replaced FID (First Input Delay) in March 2024.
CLS (Cumulative Layout Shift): How much the page layout moves around while loading. Target: under 0.1. Those annoying jumps when an ad loads and pushes content down? That’s CLS.
The report separates mobile and desktop data. Focus on mobile first since Google uses mobile-first indexing. If your mobile Core Web Vitals are failing, that affects your rankings even in desktop search results.
Core Web Vitals data in GSC requires enough traffic to populate the CrUX report. If your site is new or gets very little traffic, this report may show “Not enough data.” In that case, use Google’s PageSpeed Insights tool for lab-based testing instead.
Pages Report (Index Coverage)
The Pages report (previously called Index Coverage) shows you which pages from your site are indexed by Google and which aren’t. More importantly, it tells you why pages aren’t indexed.
The report groups pages into two main categories: Indexed and Not indexed. Under “Not indexed,” you’ll see specific reasons like:
- Crawled, currently not indexed: Google found the page but decided not to add it to the index. Often a content quality signal.
- Discovered, currently not indexed: Google knows the URL exists but hasn’t crawled it yet. Could be a crawl budget issue.
- Excluded by noindex tag: You (or your SEO plugin) told Google not to index this page. Make sure this is intentional.
- Duplicate without user-selected canonical: Google found duplicate content and chose which version to index on its own.
- Soft 404: The page returns a 200 status but looks like an error page to Google.
Check this report monthly. A sudden spike in “not indexed” pages can indicate technical problems with your site. I once caught a misconfigured robots.txt that was blocking an entire category of pages, which would have gone unnoticed for months without this report.
Search Console API and Automation
For larger sites or agencies managing multiple properties, the Search Console API opens up powerful automation possibilities. The web interface limits you to 16 months of data and 1,000 rows per report. The API gives you access to much more.
What you can do with the Search Analytics API:
- Pull performance data for all your keywords (not limited to 1,000 rows)
- Automate weekly ranking reports
- Build custom dashboards in Google Data Studio (Looker Studio)
- Set up alerts for ranking drops or traffic changes
- Compare performance across multiple properties
The easiest way to get started is with the Search Analytics for Sheets add-on for Google Sheets. It connects to the API and lets you pull data directly into spreadsheets without writing any code. I use it to build monthly reports that compare keyword positions month-over-month.
For developers, Google provides Python and JavaScript client libraries. The API supports bulk URL inspection requests (up to 2,000 per day), which is useful for monitoring indexing status across large sites.
Pairing GSC with SEO Tools
Search Console shows you how Google sees your site. But it doesn’t show you competitor data, keyword difficulty scores, backlink analysis, or content optimization suggestions. That’s where paid SEO tools come in.
My recommendation: use GSC as your foundation and pair it with Semrush for competitive research. GSC tells you what’s happening on your site. Semrush tells you what your competitors are doing and where the opportunities are.
If you use WordPress, Rank Math integrates directly with Google Search Console and displays key metrics right in your WordPress dashboard. You can see clicks, impressions, and keyword positions for each post without leaving your site. It’s the most convenient way to keep an eye on performance during your regular content workflow.
Frequently Asked Questions
How long does it take for data to appear in Google Search Console?
After verification, you’ll start seeing data within 2-3 days. However, it takes a few weeks to accumulate enough data for meaningful analysis. Search Console data has a 2-3 day processing delay, so you’re always looking at the recent past, not real-time information.
Should I use Domain property or URL prefix?
Domain property for most websites. It captures all versions of your site (http, https, www, non-www, subdomains) in one view. Use URL prefix only if you need to track a specific subdomain or directory separately, or if you don’t have access to DNS settings for verification.
Why do my Search Console numbers not match Google Analytics?
This is normal and expected. Search Console measures search appearance data (impressions, clicks from search results). Google Analytics measures website sessions (including direct, social, referral traffic). The click count in GSC may differ from organic sessions in GA because they use different counting methodologies, sampling, and time zone processing.
Can I see which keywords bring traffic to specific pages?
Yes. In the Performance report, click on a specific page in the Pages tab, then switch to the Queries tab. You’ll see all the keywords that bring impressions and clicks to that specific page. This is incredibly useful for finding content optimization opportunities, especially keywords where you rank position 8-20.
How often should I check Google Search Console?
At minimum, check it weekly. Review the Performance report for any sudden drops in clicks or impressions. Check the Pages report monthly for indexing issues. Review Core Web Vitals quarterly unless you’re actively working on site speed. Set up email alerts in GSC settings so Google notifies you of critical issues like manual actions or security problems.
Disclaimer: This site is reader-supported. If you buy through some links, I may earn a small commission at no extra cost to you. I only recommend tools I trust and would use myself. Your support helps keep gauravtiwari.org free and focused on real-world advice. Thanks. - Gaurav Tiwari