Complete Google Search Console Setup Guide
Google Search Console is the single most underused free tool in SEO. Every site owner gets it for nothing, then most people open it once a month, glance at one number, and close the tab. That’s a mistake. Done right, your Google Search Console setup turns into a direct line to how Google actually sees your site: which queries bring clicks, which pages quietly slipped, which technical issues are capping your growth before you ever notice. The setup itself takes about 10 minutes. Reading the reports well is the part that pays you back, and that’s what this guide is for.
I run Search Console on every site I touch, from this blog to education projects pulling six figures in organic traffic. So the screenshots here aren’t stock mockups. They come straight from a live property (anantamias.com, a site I help run), with the raw numbers blurred for privacy. Same interface you’ll see when you log in. Nothing staged, nothing faked.
What Is Google Search Console?
Google Search Console (formerly Google Webmaster Tools) is a free platform that shows you exactly how Google crawls, indexes, and ranks your website. Unlike third-party tools that estimate rankings from sampled data, Search Console reports actual numbers straight from Google. Real impressions. Real clicks. Real average position. No modeling, no guessing.
Think of it as Google talking back to you. You see crawl errors before they tank a page, push new content for indexing, learn which URLs drive organic traffic, and get an email the moment something breaks. It’s the foundation under any SEO-friendly website, and it costs you nothing but the 10 minutes to verify ownership.
Here’s what a working Google Search Console setup puts in front of you:
- The exact search terms that trigger your site in Google (real keyword data, not Ahrefs estimates)
- Your average ranking position for every query, by page, country, and device
- Click-through rates that tell you whether your titles and descriptions are pulling their weight
- Which sites link to you, and your most-linked pages
- Core Web Vitals performance from real Chrome users
- Indexing status for every URL, plus the reason any page is excluded
- Security issues, manual actions, and (newest of all) your visibility inside AI Overviews and AI Mode
How to Set Up Google Search Console
Before you see any data, you have to prove you own or manage the site. Google calls this verification. The whole flow runs about 10 minutes, even on the slowest path (manual DNS). Here are the five steps to set up Google Search Console from scratch.
Step 1: Sign In to Google
Go to search.google.com/search-console and sign in with the Google account you want tied to this site. Use a business account you’ll keep, not a personal one you might lose access to later. Click “Start now” and you land on the property setup screen.
Step 2: Choose Your Property Type
Google offers two property types, and the choice matters more than it looks.
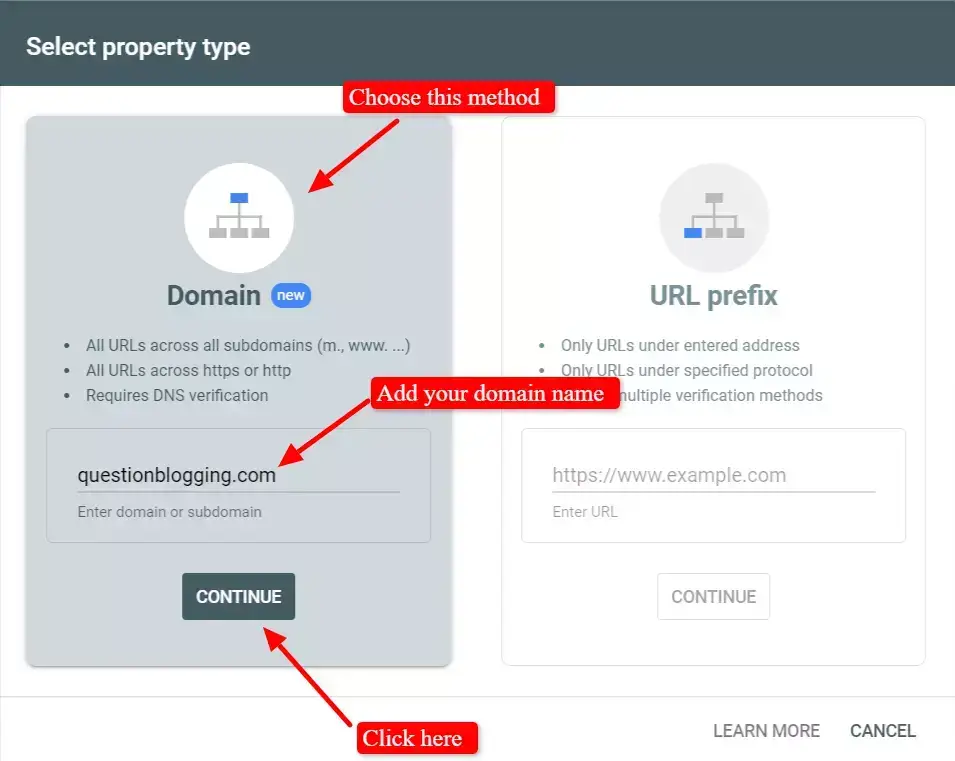
Domain property covers your entire domain: every subdomain, both http and https, and the www and non-www versions, all in one bucket. Enter just the bare domain (example.com), no protocol. This is what I pick for almost every site because you never lose data hiding in a URL variation you forgot existed.
URL prefix tracks only the exact pattern you enter. Add https://example.com and it ignores http://example.com and https://www.example.com completely. You’d register each variant separately. Use it only when you genuinely want to isolate one subdomain or section, like tracking a blog subfolder on its own.
For most websites, go Domain. One property, every version of your site, zero blind spots. The only catch is that Domain property forces DNS verification, which I’ll cover next.
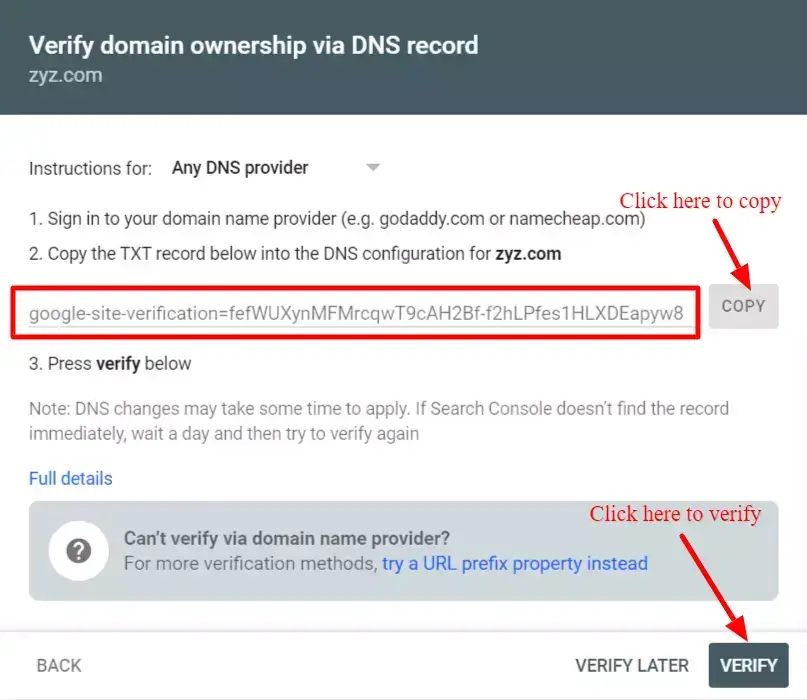
Step 3: Verify Your Site
Verification is where people stall, so here’s the plain-English version of each method and when to use it.
| Verification method | Works with | Best for |
|---|---|---|
| DNS TXT record | Domain property | The default, and the only option for Domain property. Add one TXT record at your registrar. |
| HTML file upload | URL prefix | You have FTP or file-manager access and prefer not to touch DNS. |
| HTML meta tag | URL prefix | WordPress users. Paste one tag, or use a plugin field. Fastest for most blogs. |
| Google Analytics | URL prefix | GA4 is already installed on the same Google account. One click, done. |
DNS verification is the path for Domain property. Google hands you a TXT record. Copy it, log into your registrar or DNS host (Cloudflare, Namecheap, GoDaddy), paste it into a new TXT record, wait a few minutes for propagation, then come back and click Verify.
On WordPress, the meta-tag route is even simpler. Rank Math has a dedicated field under General Settings, Webmaster Tools, where you paste the verification code once and forget it. No theme files, no FTP.
If Cloudflare runs your DNS, the verification is basically automatic. Search Console detects Cloudflare and offers a one-click flow that writes the TXT record for you. No copy-paste, no propagation wait. It’s the fastest verification I’ve used.
Step 4: Submit Your Sitemap
A sitemap is the index that tells Google which pages exist, so nothing important gets missed. Most WordPress SEO plugins generate one automatically, usually at yoursite.com/sitemap_index.xml or yoursite.com/sitemap.xml. To submit it, open the Sitemaps report in the left sidebar, paste the sitemap URL, and hit Submit.
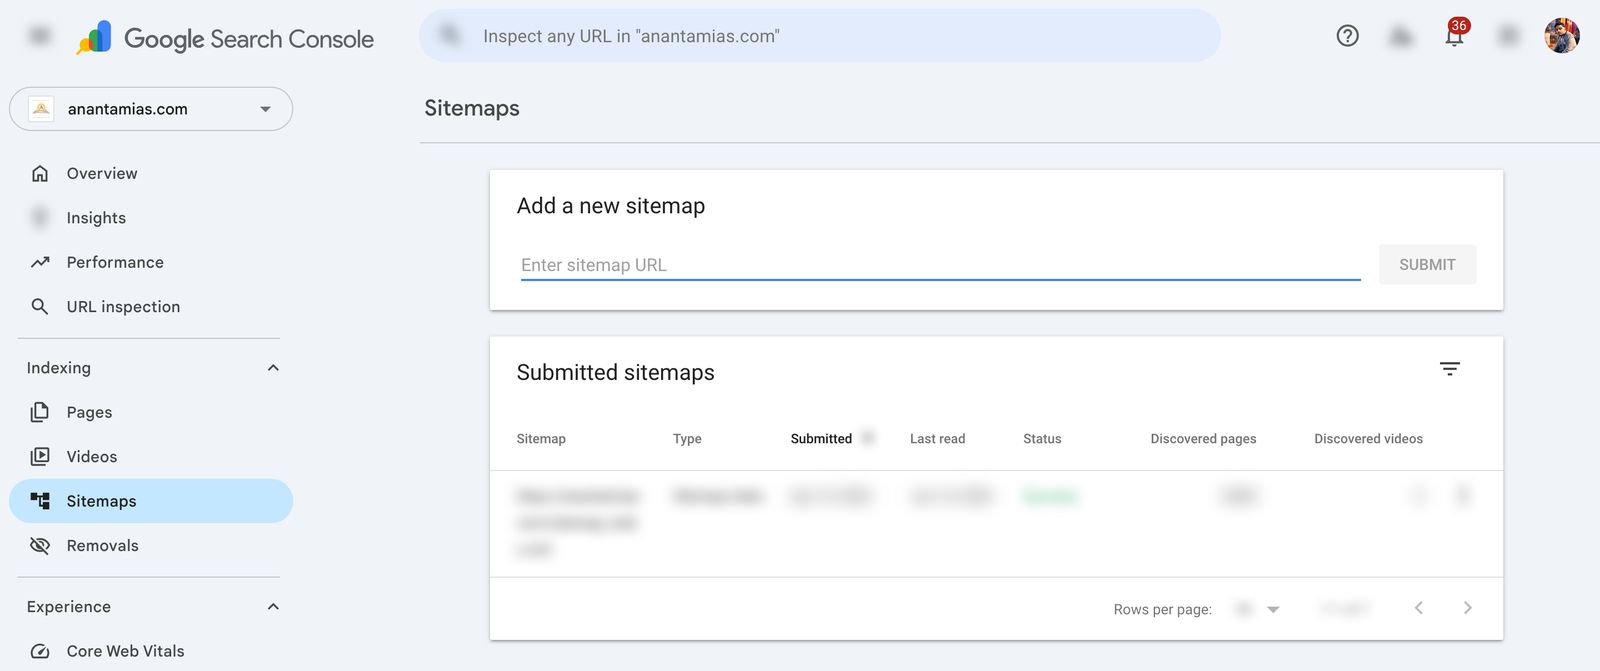
Once it’s submitted, this report becomes a quiet early-warning system. If the status flips from Success to an error, or the discovered-pages count suddenly drops, you’ve got a crawling problem worth chasing before it costs you rankings.
Step 5: Connect Google Analytics
This step is optional but worth two minutes. Linking the accounts surfaces Search Console queries inside your GA4 reports, so you can tie search terms to on-site behavior. Open Google Analytics, go to Admin, find the Search Console links section under property settings, and connect your verified property. Google refreshed its guidance on combining GA4 and Search Console data in 2026, and the link is cleaner than it used to be.
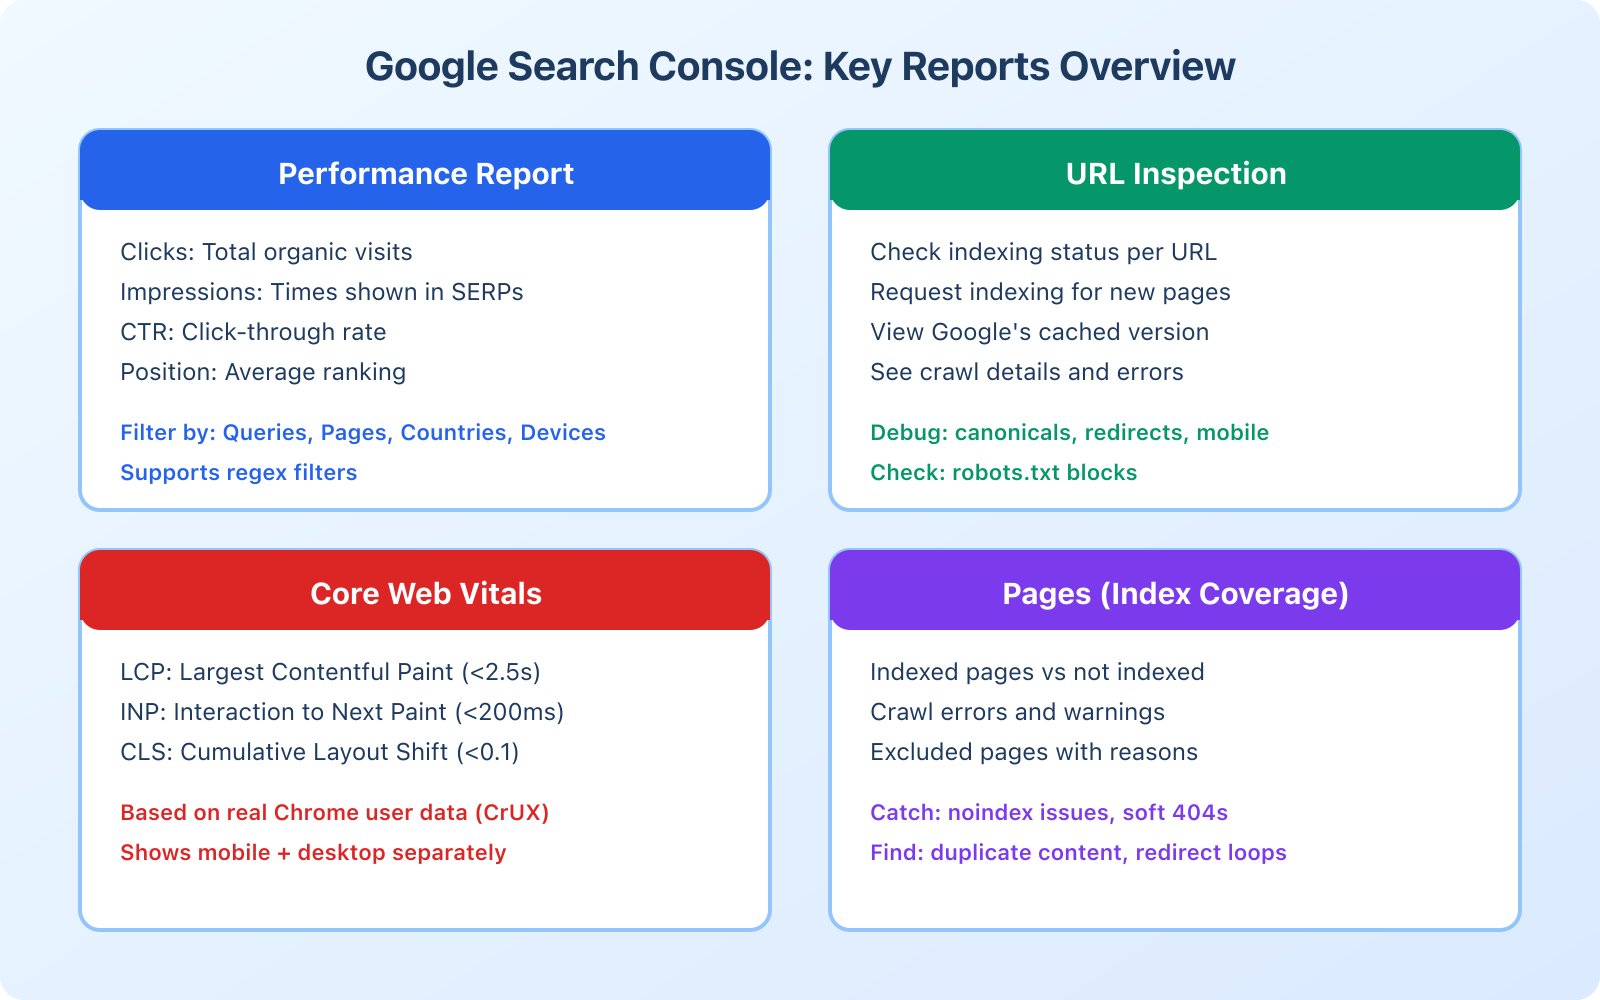
What the Search Console Dashboard Shows You
Data starts landing within two to three days of verification. The Overview is your home base: a performance snapshot, an indexing summary, and a Recommendations panel that Google rolled out globally in August 2024.
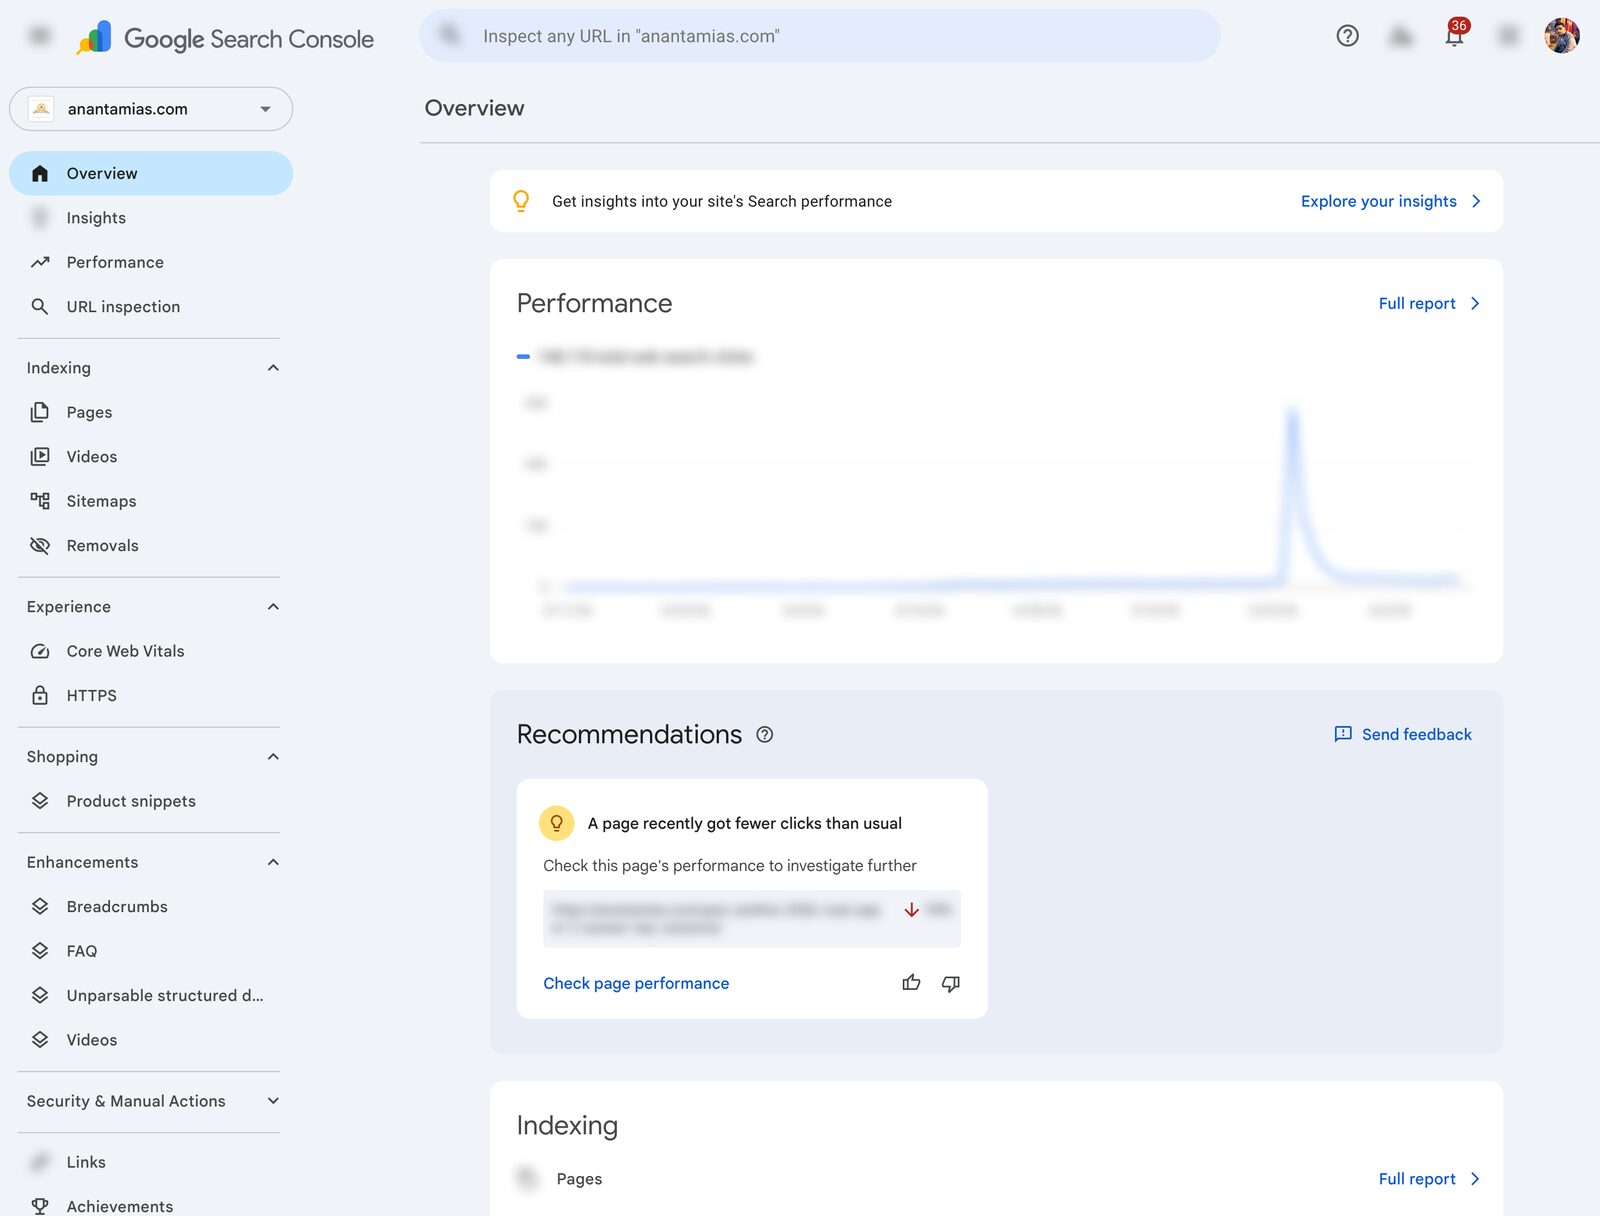
That Recommendations card is more useful than it first looks. On the property above, it flagged a page that “recently got fewer clicks than usual” and linked me straight to it. It won’t replace your own judgment, but as a free nudge toward pages that need attention, it earns its spot on the home screen.
Understanding the Performance Report
The Performance report is where you’ll spend most of your time, and it’s the most actionable free data anywhere in SEO. It has a filter bar up top, a trend chart, and a table that breaks everything down by queries, pages, countries, devices, and search appearance.
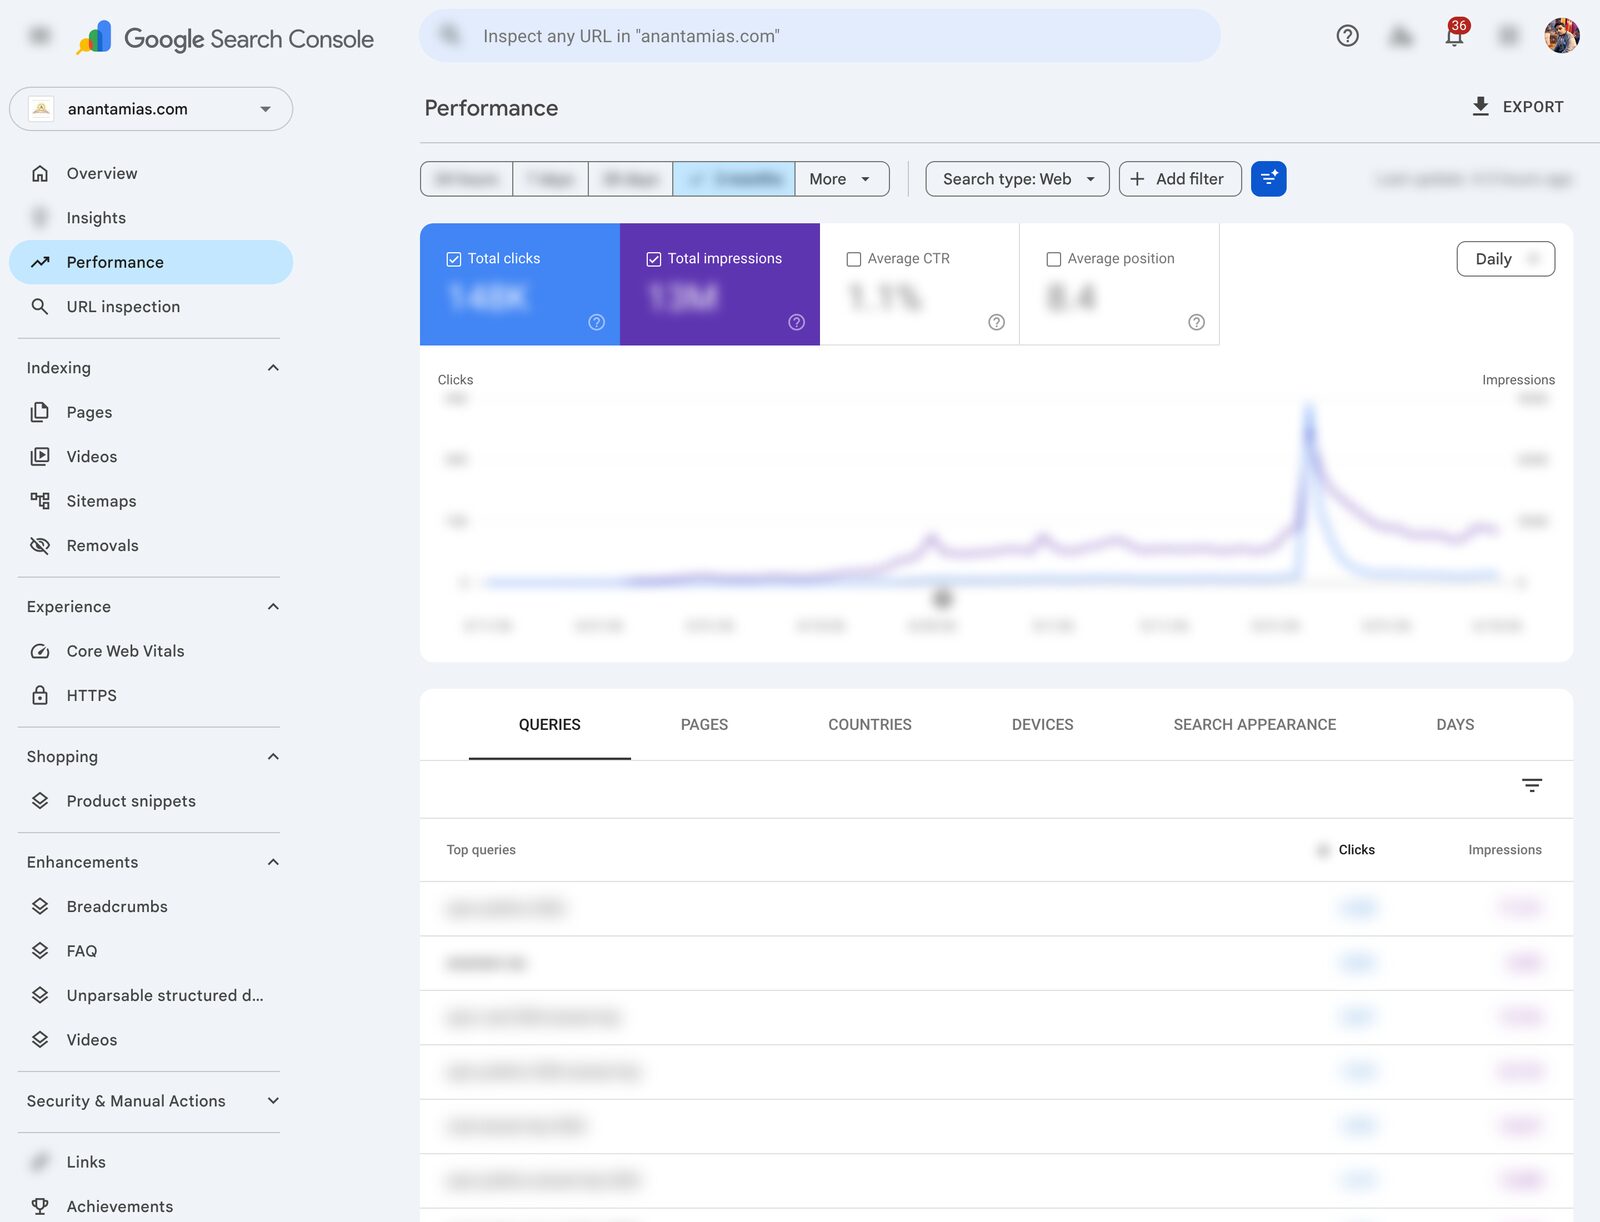
The Four Key Metrics
Impressions: how many times your pages appeared in results. High impressions with low clicks means your title or meta description is doing a bad job. You’re showing up, people just aren’t biting.
Clicks: actual visits from search. This is your organic traffic from Google, unfiltered and accurate.
CTR: clicks divided by impressions. Three to five percent is typical across most positions. Higher means your listing is compelling. Lower means you’re visible but not enticing.
Average position: where you rank on average. Position 1 to 3 is the money zone. Position 4 to 10 is page one but below the fold. Past 10 you’re on page two, where clicks fall off a cliff.
How to Find Your Biggest Opportunities
The Performance report rewards a few specific reads. Here’s what I check first, every time.
High impressions, low CTR. The page ranks but nobody clicks. Rewrite the title tag and meta description with a number, a bracket, or a power word. A sharper title can lift CTR 20 to 30 percent without moving your position at all.
Position 8 to 20 queries. These are your low-hanging fruit. You’re on the edge of page one already. A few hundred extra words, a couple of internal links, and three to five backlinks can push them up where the clicks live. Sort the table by impressions and start there.
Declining clicks. Switch on the date comparison and put the last three months against the prior three. Pages bleeding clicks are either going stale or getting outranked by something fresher. That’s your content audit shortlist.
One 2026 upgrade worth knowing: the 24-hour view. Google launched it in December 2024, and it now shows hourly clicks and impressions with only a few hours of delay, plus a comparison mode that stacks the last 24 hours against the previous day or the same window last week. For a fresh publish or a breaking-news page, you finally see traction the same afternoon instead of waiting three days. Filters are sticky now too, so your favorite views survive a page reload.
Using Regex Filters for Advanced Analysis
The most underused feature in the whole report is regex filtering. In the Performance report, click the filter button, choose Query, then pick “Custom (regex).” Suddenly you can slice your data the way basic filters can’t.
best|top|reviewisolates commercial-intent querieshow to|guide|tutorialpulls your informational traffic^(?!.*brandname)excludes branded queries so you see true discoveryvs|versus|comparisonfinds comparison-intent searches you could target with a new page
If you’ve never touched regex, start with the pipe character for “or” matching. That one operator covers most of what you’ll ever need here. It’s the 80/20 of the whole feature.
The URL Inspection Tool
The URL Inspection tool shows you exactly how Google sees one specific page. Paste any URL from your site into the search bar at the very top of Search Console and you get the full picture.
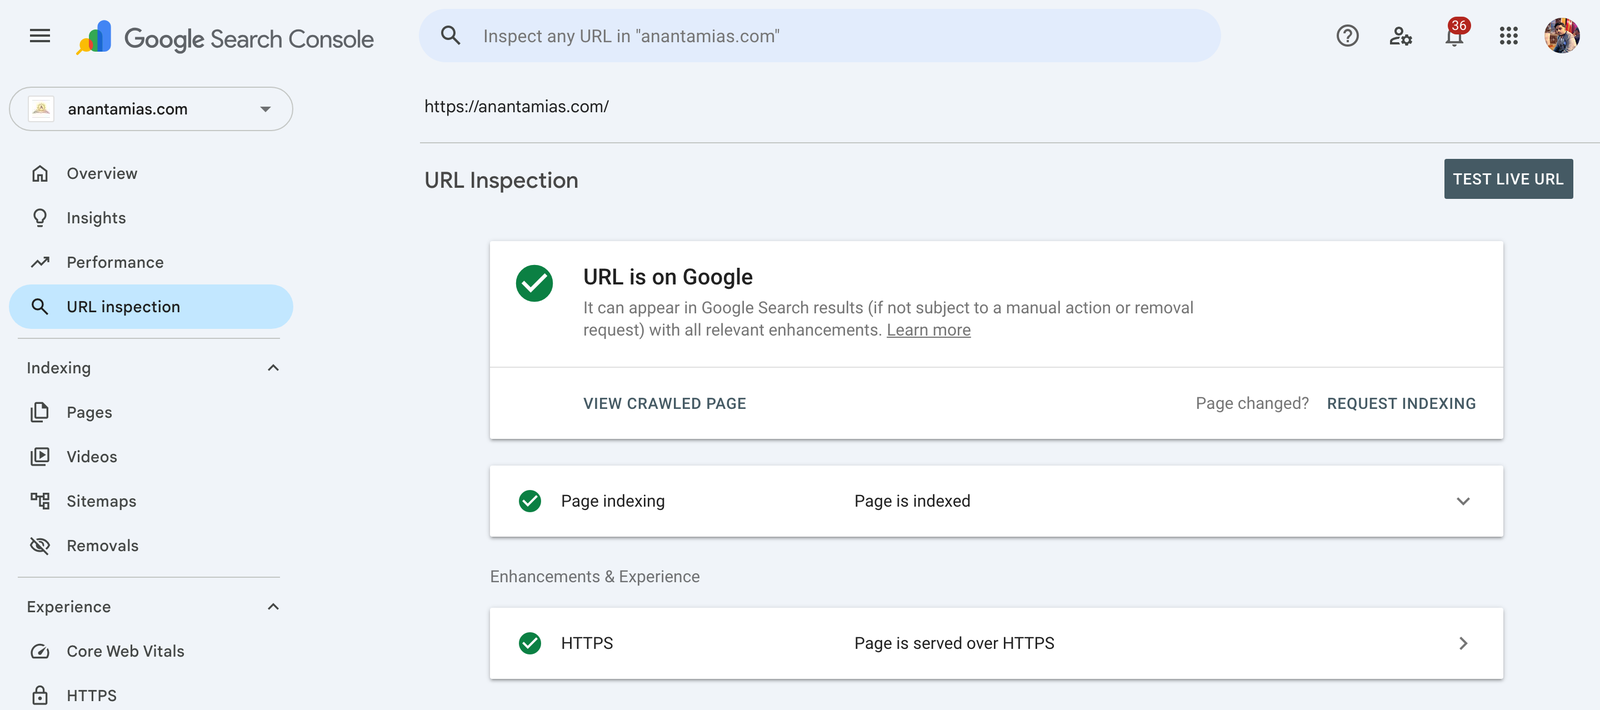
- Whether the page is indexed (and “URL is on Google” if it is)
- Which canonical Google actually chose, which is sometimes not the one you set
- When Googlebot last crawled it
- Whether it’s served over HTTPS and free of crawl or indexing errors
The button you’ll use most is “Request Indexing.” After publishing a new post or making real changes to an old one, paste the URL and request it. Google usually re-crawls within hours instead of days. I run this after every meaningful edit, and it’s a lifesaver during a cleanup of orphan or stale pages when you’re updating a batch at once.
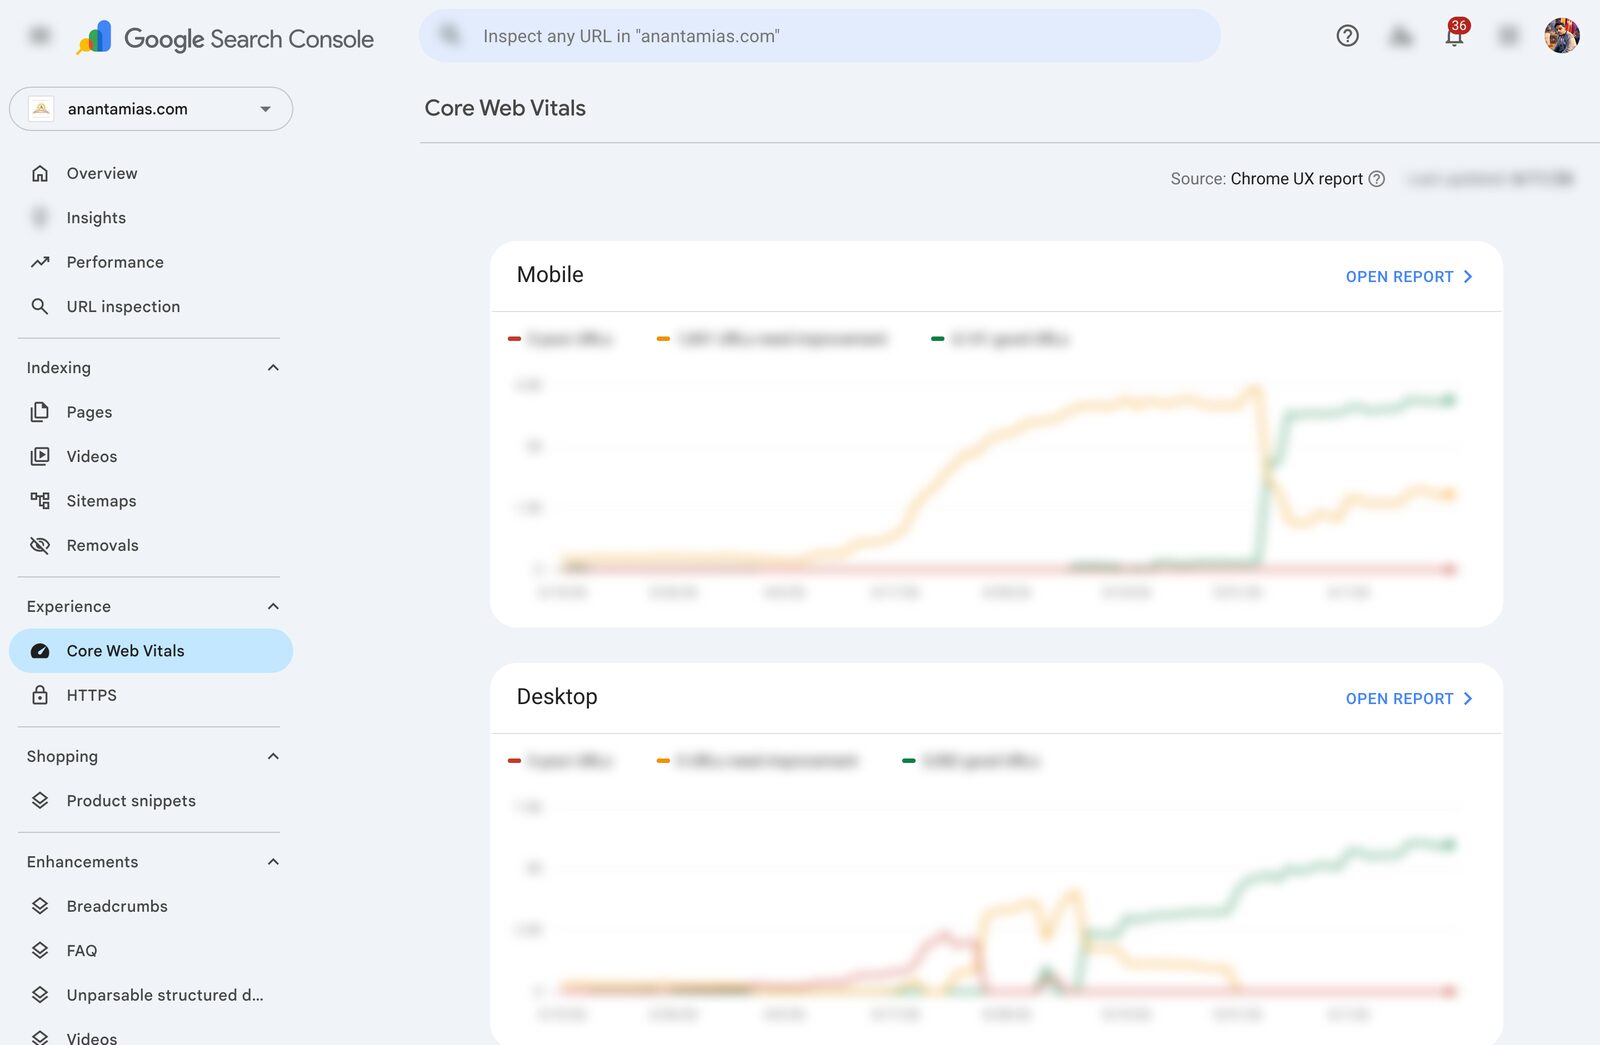
Core Web Vitals in Search Console
Core Web Vitals are a real ranking signal, and the report in Search Console grades you on data from actual Chrome users (the Chrome User Experience Report, or CrUX), not a lab test.
Three metrics, three thresholds to hit:
LCP (Largest Contentful Paint): how fast the main content loads. Good is under 2.5 seconds. Usually it’s your hero image or the biggest text block.
INP (Interaction to Next Paint): how fast the page responds when someone taps, clicks, or types. Good is under 200 milliseconds. INP replaced FID back in March 2024, and it’s a tougher, more honest measure of real responsiveness.
CLS (Cumulative Layout Shift): how much the layout jumps around while loading. Good is under 0.1. Those annoying shifts when an ad loads and shoves the text down? That’s CLS, and Google counts it.
Here’s the rule people miss: Google grades at the 75th percentile, so a URL group only earns “Good” when at least 75 percent of real visits clear all three thresholds at once. It’s a high bar. As of the May 2026 CrUX data, only 55.9 percent of all tracked sites pass all three Core Web Vitals together. Clear it and you’re already ahead of nearly half the web.
The report splits mobile and desktop. Fix mobile first, always, because Google indexes mobile-first, so failing mobile vitals drags your desktop rankings down too. If your site is new and the report says “Not enough data,” it just means CrUX hasn’t gathered enough real traffic yet. Use PageSpeed Insights for lab testing in the meantime.
The Page Indexing Report
The Page indexing report (it used to be called Index Coverage) tells you which URLs Google has indexed, which it hasn’t, and the exact reason for every exclusion. This is the report that catches disasters early.
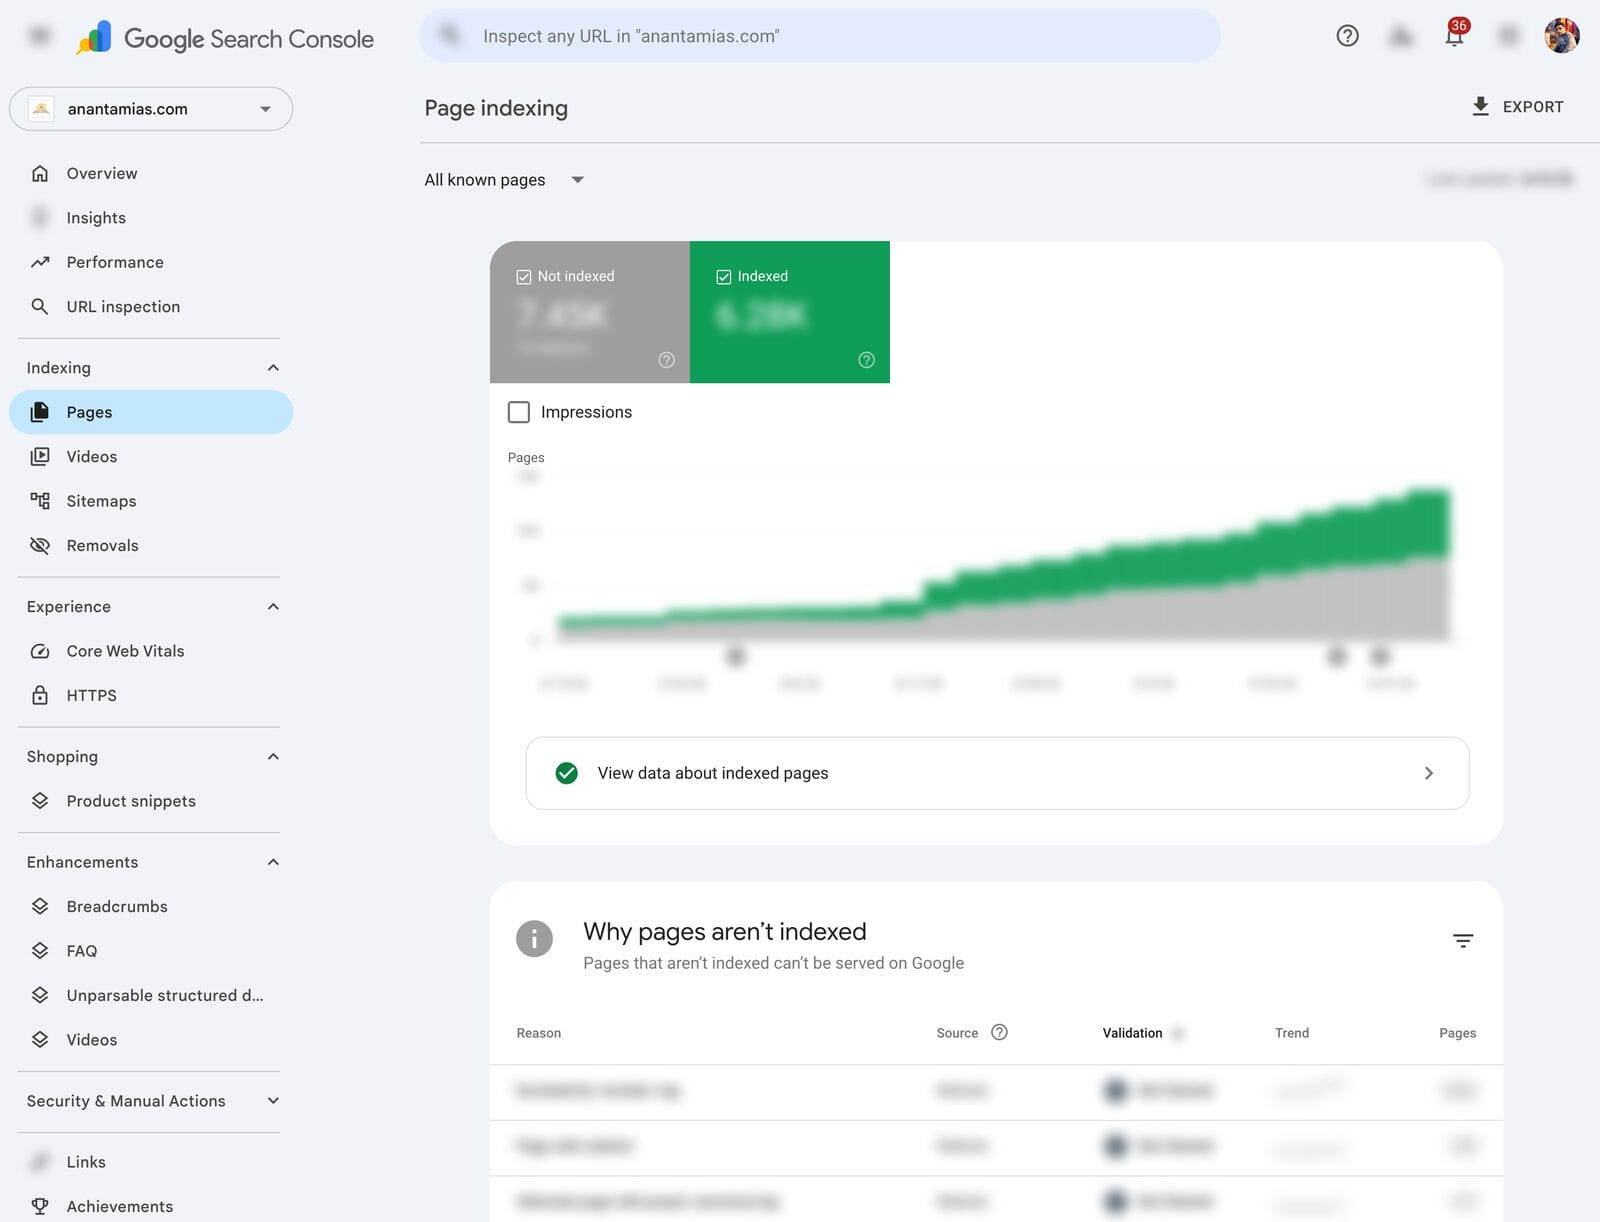
Under “Why pages aren’t indexed,” you’ll see specific reasons. The ones worth knowing:
- Crawled, currently not indexed: Google saw the page and chose not to index it. Usually a content-quality signal. Make the page genuinely better or merge it.
- Discovered, currently not indexed: Google knows the URL exists but hasn’t crawled it yet. Often a crawl-budget or internal-linking issue.
- Excluded by noindex tag: you or your SEO plugin told Google to skip it. Confirm that was intentional.
- Duplicate without user-selected canonical: Google found duplicate content and picked the canonical for you. A clean URL structure prevents most of these.
- Soft 404: the page returns a 200 status but looks like an error to Google. Thin content is the usual culprit.
Check this report monthly. A sudden spike in “not indexed” almost always means a technical break. I once caught a misconfigured robots.txt blocking an entire category of pages here. Without this report it would have quietly bled traffic for months before anyone noticed.
Tracking Your AI Search Visibility
This is the newest reason to keep Search Console open in 2026. On June 3, 2026, Google started rolling out dedicated reports for generative AI visibility: a separate view of how often your URLs surface inside AI Overviews and AI Mode in Search, plus generative features in Discover.
Be clear-eyed about the limits. Right now it’s impressions only. No clicks, no CTR, so you can’t yet compare AI visibility against traditional search performance. And Google is shipping it to a subset of sites first, so you might not see the report on your property yet. Still, it’s the first official window into AI-search exposure that doesn’t rely on a third-party scraper, and for anyone serious about GEO it’s the metric to watch as it matures.
The Disavow Links Tool (Handle With Care)
Search Console hides one tool from the sidebar on purpose. The Disavow Links Tool, at search.google.com/search-console/disavow-links, tells Google to ignore specific backlinks. Most sites should never touch it. Google’s own line, repeated by Gary Illyes through 2023, is that Penguin 4.0 (September 2016) already devalues junk links automatically, so disavowing usually changes nothing.
Three cases still justify it: a manual action that specifically cites “unnatural links,” a real negative SEO attack you can tie to actual ranking damage, or a domain you bought that came with a paid-link history. Outside those, the null action wins. I’ve watched a panicked owner disavow 2,000 domains and lose 40 percent of their organic traffic the next quarter. If your rankings dropped and you’re hunting for a lever, this isn’t it. Audit your content and Core Web Vitals first, because the link profile is rarely where the answer lives.
Pairing Search Console With SEO Tools
Search Console shows you how Google sees your site. What it doesn’t show is competitor data, keyword difficulty, full backlink analysis, or content-gap suggestions. That’s the job of a paid SEO tool, and the two work best as a pair.
My setup: Search Console as the source of truth for my own site, and Semrush for everything outside it. Search Console tells you what’s happening on your pages. Semrush tells you what competitors rank for and where the gaps are. One is your dashboard, the other is your map.
If you’re on WordPress, Rank Math pipes Search Console metrics straight into your dashboard, so you see clicks, impressions, and positions per post without leaving the editor. For a deeper look at how that integration holds up day to day, here’s my full Rank Math review. It’s the most convenient way to keep an eye on performance inside your normal writing workflow.
The Bottom Line on Google Search Console
Most people treat Google Search Console as a vanity dashboard, a place to confirm traffic exists. The ones who win treat it as a to-do list. Every high-impression low-CTR query is a title to rewrite. Every position 8-to-20 keyword is a page to strengthen. Every “not indexed” spike is a fire to put out. The setup takes ten minutes. The habit of reading it weekly is what actually moves rankings.
Quick poll: How often do you actually open Google Search Console?
Frequently Asked Questions
How long does it take for data to appear in Google Search Console?
After you verify, data starts showing within 2 to 3 days, though it takes a few weeks to build enough history for solid analysis. Search Console runs on a 2 to 3 day processing delay, so you’re always reading the recent past. The exception is the 24-hour view, which now updates hourly.
Is Google Search Console free?
Yes, completely free with no paid tier. Every verified site owner gets full access to performance data, indexing reports, Core Web Vitals, and the URL Inspection tool at no cost. There’s no premium upgrade, only the standard 16-month data window and 1,000-row report limit in the web interface.
Should I use Domain property or URL prefix?
Domain property for almost every site. It captures all versions of your site (http, https, www, non-www, and subdomains) in one place. Pick URL prefix only when you need to track a single subdomain or folder on its own, or when you can’t edit DNS records for verification.
Do I still need Google Search Console if I have Google Analytics?
Yes, they answer different questions. Search Console shows how you appear in Google Search: impressions, clicks, queries, and rankings. Analytics shows what visitors do after they arrive, across every source. You want both, and linking them puts search-query data right inside your GA4 reports.
Why don’t my Search Console numbers match Google Analytics?
This is normal. Search Console counts search appearances (impressions and clicks from Google results), while Analytics counts website sessions from every traffic source. The two use different methodologies, sampling, and time zones, so the click count rarely matches organic sessions in GA4. Don’t try to reconcile them to the digit.
How do I fix the ‘Discovered, currently not indexed’ status?
It usually points to crawl budget or thin value. Strengthen internal links to the page so Google finds it more easily, make the content genuinely worth indexing, then submit the URL through the URL Inspection tool. On large sites, a tighter sitemap and fewer low-value URLs help Google spend its crawl budget where it counts.
Can I set up Google Search Console on WordPress without code?
Yes. The easiest path is an SEO plugin like Rank Math or Yoast, which both give you a field to paste the verification meta tag, no theme editing required. Or use DNS verification at your host, which needs no site changes at all. Either way, your Google Search Console setup stays completely code-free.
How often should I check Google Search Console?
Weekly for the Performance report, watching for sudden drops in clicks or impressions. Monthly for the Page indexing report to catch crawl issues early. Quarterly for Core Web Vitals unless you’re actively fixing speed. Turn on email alerts in settings so Google pings you about manual actions or security problems the moment they happen.
Disclaimer: This site is reader-supported. If you buy through some links, I may earn a small commission at no extra cost to you. I only recommend tools I trust and would use myself. Your support helps keep gauravtiwari.org free and focused on real-world advice. Thanks. - Gaurav Tiwari