Linear Regression Calculator
Use this free linear regression calculator to find the best-fit line, correlation coefficient (r), R² value, and residuals for your data with an interactive scatter plot.
Find the line of best fit, correlation coefficient, and R² value for your data.
Enter X and Y values separated by commas or spaces, one pair per line
Regression Equation
Statistics
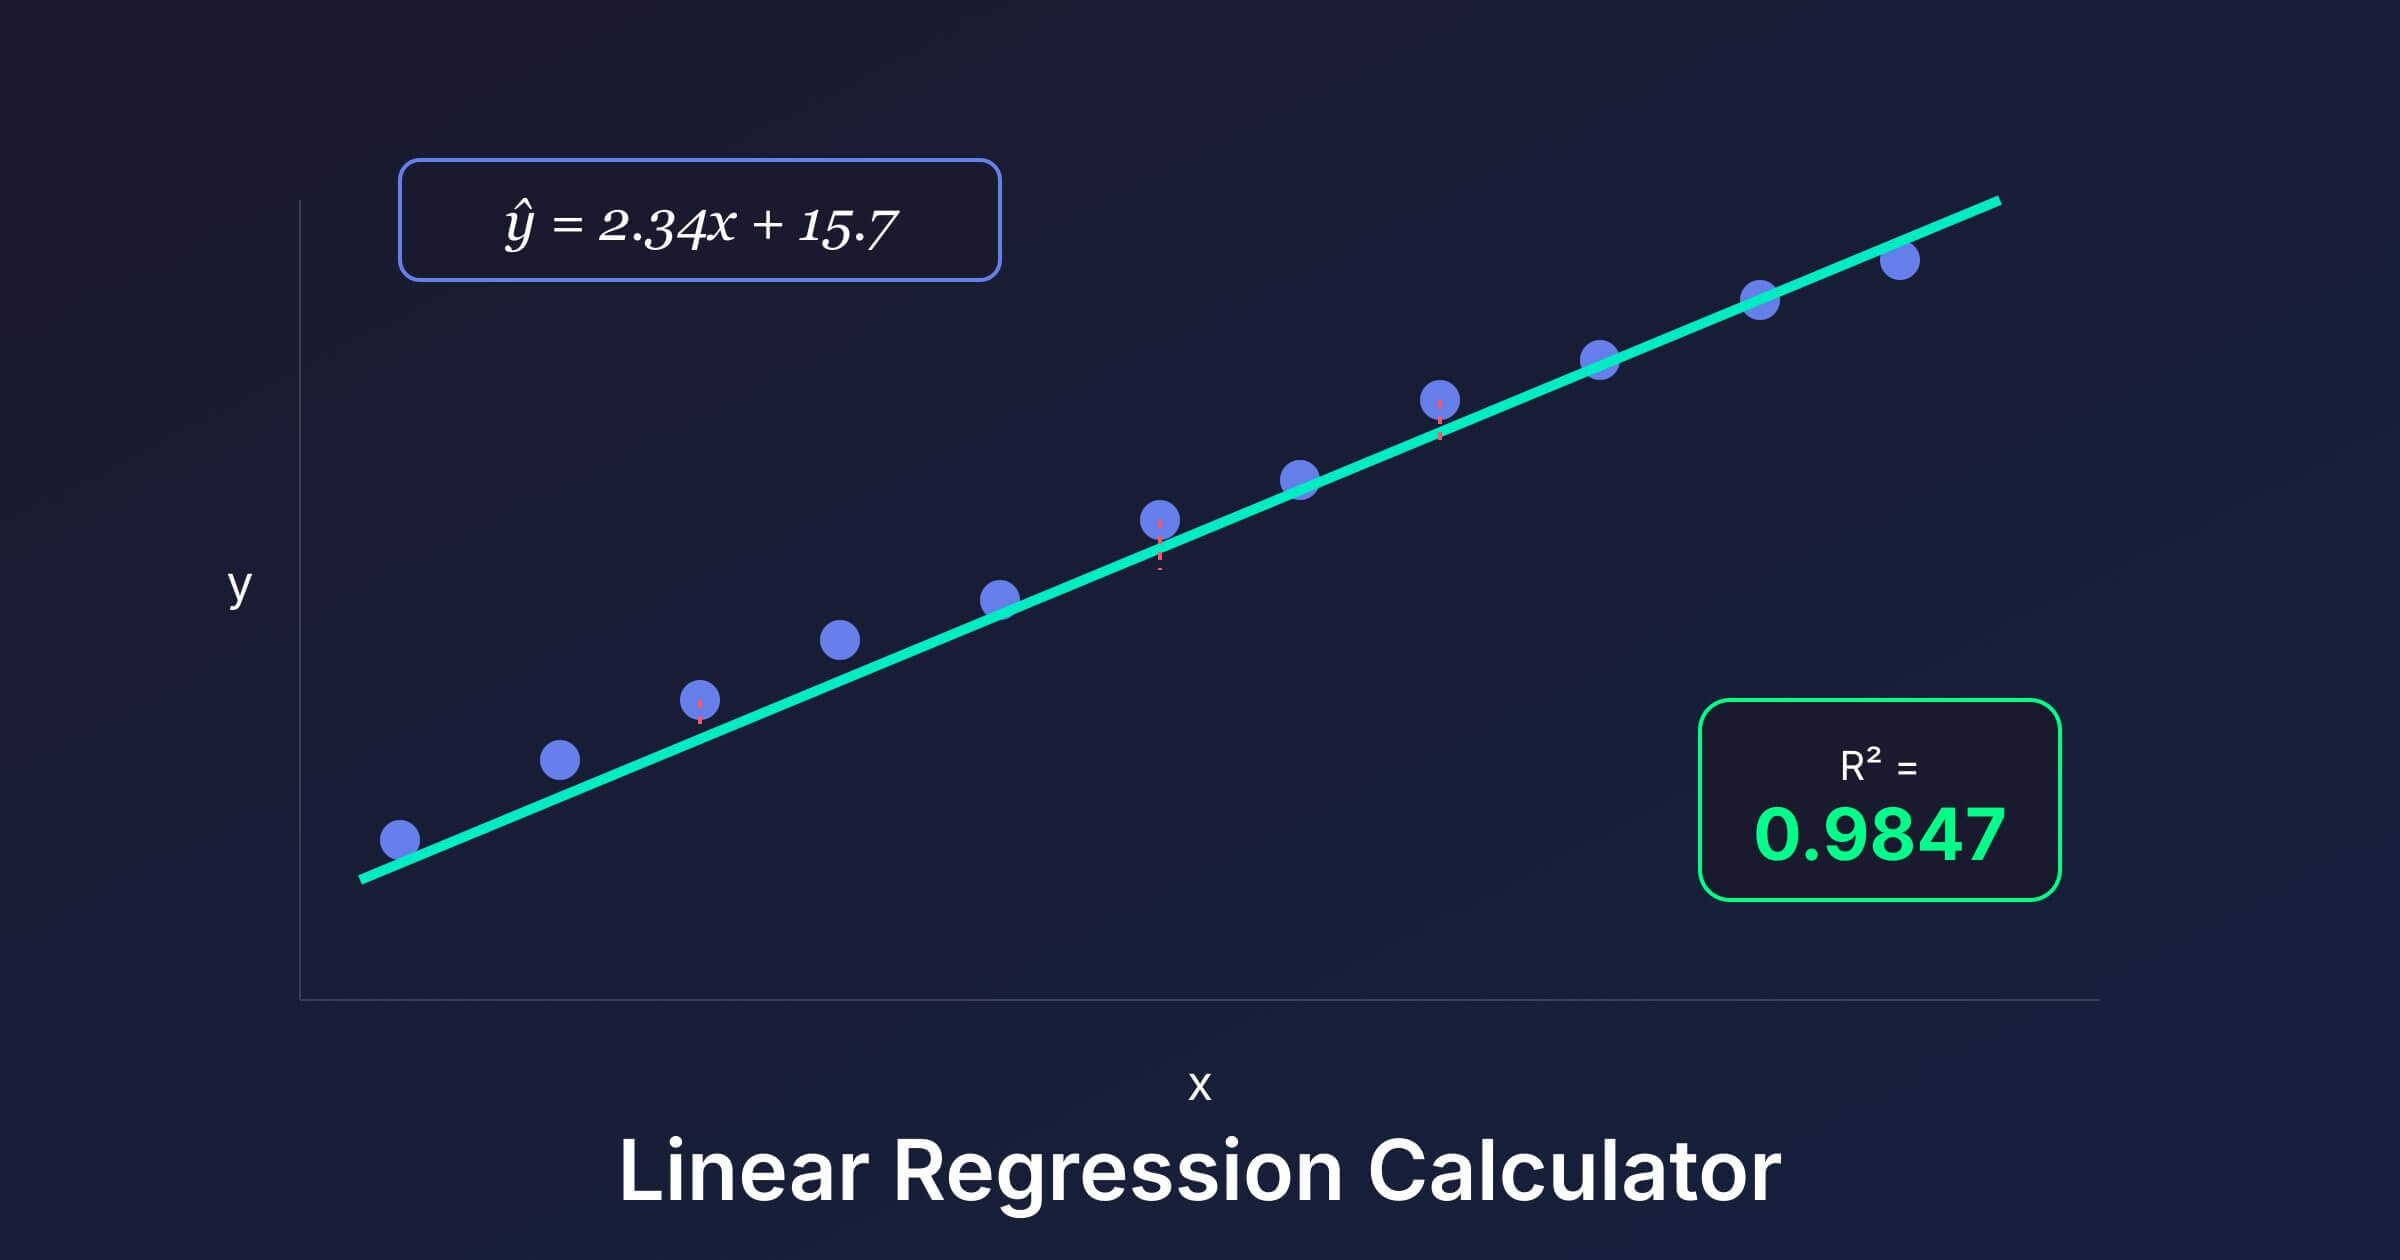
Scatter Plot with Regression Line
Residuals
What Is Linear Regression?
Linear regression is a statistical method for modeling the relationship between a dependent variable \(y\) and one or more independent variables \(x\). Simple linear regression fits a straight line to data:
$$\hat{y} = bx + a$$
where \(b\) is the slope (rate of change) and \(a\) is the y-intercept. The method of least squares finds the values of \(a\) and \(b\) that minimize the sum of squared residuals.
The Least Squares Method
The slope \(b\) and intercept \(a\) are calculated using these formulas:
$$b = \frac{n\sum x_i y_i – \sum x_i \sum y_i}{n\sum x_i^2 – (\sum x_i)^2}$$
$$a = \bar{y} – b\bar{x}$$
These formulas minimize the sum of squared errors \(\text{SSE} = \sum(y_i – \hat{y}_i)^2\), ensuring the line passes through the point \((\bar{x}, \bar{y})\) — the centroid of the data.
Correlation Coefficient (r)
The Pearson correlation coefficient \(r\) measures the strength and direction of the linear relationship between two variables:
$$r = \frac{n\sum x_i y_i – \sum x_i \sum y_i}{\sqrt{(n\sum x_i^2 – (\sum x_i)^2)(n\sum y_i^2 – (\sum y_i)^2)}}$$
- \(r = 1\): Perfect positive linear relationship
- \(r = -1\): Perfect negative linear relationship
- \(r = 0\): No linear relationship
- \(|r| \geq 0.7\): Strong correlation
- \(0.4 \leq |r| < 0.7\): Moderate correlation
- \(|r| < 0.4\): Weak correlation
R-Squared (Coefficient of Determination)
\(R^2\) is the square of the correlation coefficient and represents the proportion of variance in the dependent variable explained by the independent variable:
$$R^2 = 1 – \frac{\text{SS}_{\text{residual}}}{\text{SS}_{\text{total}}} = \frac{\text{SS}_{\text{regression}}}{\text{SS}_{\text{total}}}$$
An \(R^2 = 0.85\) means that 85% of the variability in \(y\) is explained by the linear relationship with \(x\). The remaining 15% is due to other factors or random variation.
Residuals and Residual Analysis
A residual is the difference between an observed value and the predicted value: \(e_i = y_i – \hat{y}_i\). Residual analysis helps verify regression assumptions:
- Randomly scattered residuals: Suggests the linear model is appropriate
- Patterned residuals (curved, funnel-shaped): Indicates the relationship may be nonlinear or that variance is not constant
- Large individual residuals: May indicate outliers that disproportionately affect the regression line
Standard Error of Estimates
The standard error of the slope and intercept quantify the uncertainty in the estimated coefficients:
$$SE_b = \frac{s}{\sqrt{\sum(x_i – \bar{x})^2}}$$
where \(s = \sqrt{\text{SSE}/(n-2)}\) is the residual standard error. Smaller standard errors indicate more precise estimates. These are used to construct confidence intervals and perform hypothesis tests on the regression coefficients.
Assumptions of Linear Regression
- Linearity: The relationship between \(x\) and \(y\) is linear
- Independence: Observations are independent of each other
- Homoscedasticity: The variance of residuals is constant across all values of \(x\)
- Normality: Residuals are approximately normally distributed
Violating these assumptions can lead to biased estimates, incorrect standard errors, and unreliable predictions.
Applications of Linear Regression
- Prediction: Forecasting future values based on historical trends (e.g., sales projections)
- Science: Determining the relationship between experimental variables
- Economics: Modeling supply-demand relationships, price elasticity
- Medicine: Studying dose-response relationships
- Engineering: Calibrating instruments and modeling physical relationships
FAQs
What is the difference between r and R² in regression?
The correlation coefficient r measures the strength and direction of the linear relationship (ranging from -1 to 1). R² is r squared and represents the proportion of variance in Y explained by X (ranging from 0 to 1). If r = 0.9, then R² = 0.81, meaning 81% of Y’s variation is explained by X.
How do I interpret the slope of a regression line?
The slope tells you how much Y changes for each one-unit increase in X. If the slope is 3.5, then Y increases by 3.5 units on average when X increases by 1 unit. A negative slope means Y decreases as X increases. The slope represents the average rate of change, not a guarantee for individual predictions.
What is a residual in linear regression?
A residual is the difference between an actual observed value and the value predicted by the regression line (residual = observed – predicted). Positive residuals mean the actual value was above the line; negative means below. The sum of all residuals in a least squares regression always equals zero.
Why does the least squares method minimize squared errors?
Squaring errors ensures all errors are positive (so they don’t cancel out) and penalizes larger errors more heavily than smaller ones. This method also produces a unique solution with nice mathematical properties. Squaring makes the function differentiable, which allows us to find the minimum using calculus.
Can I use linear regression if my data isn’t perfectly linear?
You can fit a line to any data, but it may not be meaningful if the relationship is curved. Check your residual plot: if residuals show a pattern (like a curve), linear regression isn’t appropriate. You might need polynomial regression, logarithmic transformation, or other non-linear methods instead.
What is the difference between correlation and causation?
Correlation means two variables move together; causation means one actually causes the other. Ice cream sales and drowning deaths are correlated (both increase in summer), but ice cream doesn’t cause drowning. Linear regression shows correlation, not causation. Establishing causation requires controlled experiments or careful causal inference methods.
How many data points do I need for linear regression?
Technically you can fit a line with just 2 points, but for meaningful statistical analysis, you need more. A common rule of thumb is at least 10-20 observations per predictor variable. More data generally gives more reliable estimates of the slope and better predictions, especially if there’s variability in your data.
What does it mean if my R² is low?
A low R² means the linear model doesn’t explain much of the variation in your data. This could mean: (1) there’s no strong linear relationship, (2) the relationship is non-linear, (3) other important variables are missing, or (4) your data has high natural variability. A low R² doesn’t mean the model is useless—it depends on your field and goals.