Punnett Square
A Punnett square is a simple 2D grid that predicts the genotype and phenotype ratios of offspring from a known parental cross. Invented by the English geneticist Reginald Punnett in 1905, the diagram is the standard visual tool for teaching Mendelian inheritance. It takes the two alleles from each parent, lays them out on the top and side of a square, and shows every possible combination in the cells. Master the 2×2 case and you can predict the outcome of any single-gene cross.
The Vocabulary You Need First
- Gene: a unit of heredity that controls a particular trait (e.g., flower color).
- Allele: a specific version of a gene. A gene for flower color might have two alleles: B (purple, dominant) and b (white, recessive).
- Genotype: the genetic makeup written as letters (e.g., BB, Bb, bb).
- Phenotype: the observable trait that results (e.g., purple flowers, white flowers).
- Homozygous: two identical alleles (BB or bb).
- Heterozygous: two different alleles (Bb).
- Dominant allele: shown by capital letter (B); masks the recessive when present.
- Recessive allele: shown by lowercase letter (b); only shows in the phenotype when homozygous (bb).
Building a 2×2 Punnett Square
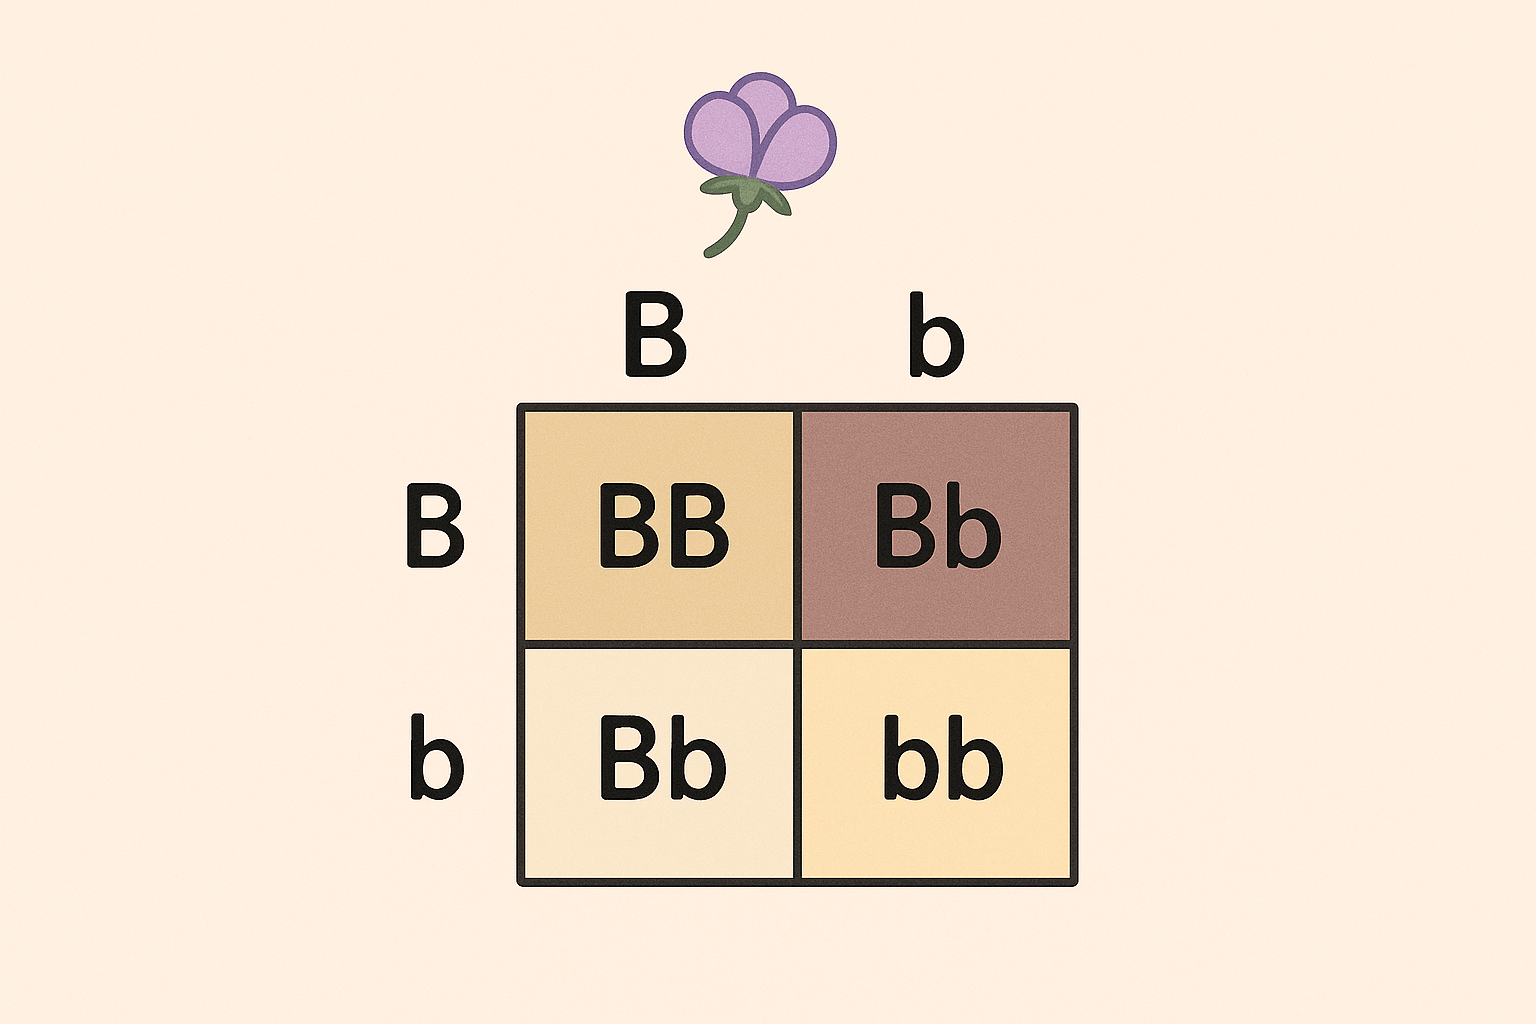
The classic single-gene cross. Two heterozygous parents (Bb × Bb):
- Write Parent 1’s alleles across the top. One allele above each column (B in the first column, b in the second).
- Write Parent 2’s alleles down the left side. One allele to the left of each row (B in the first row, b in the second).
- Fill each cell. Combine the column allele with the row allele. The top-left cell is BB. The top-right is Bb. The bottom-left is Bb. The bottom-right is bb.
Read the result:
| Genotype | Count out of 4 | Phenotype (if B dominant) |
|---|---|---|
| BB | 1 | Purple (homozygous dominant) |
| Bb | 2 | Purple (heterozygous) |
| bb | 1 | White (homozygous recessive) |
Genotypic ratio: 1 BB : 2 Bb : 1 bb. Phenotypic ratio: 3 purple : 1 white. The famous 3:1 ratio from Mendel’s pea experiments comes straight out of this square.
Other Common Crosses
Homozygous Dominant × Homozygous Recessive (BB × bb)
All four cells of the square produce Bb offspring. Every offspring is heterozygous and shows the dominant phenotype. This is the F1 generation in Mendel’s experiments — pure-bred parents always produce uniformly heterozygous offspring.
Heterozygous × Homozygous Recessive (Bb × bb)
Half the cells are Bb (dominant phenotype), half are bb (recessive). 1:1 phenotypic ratio. This is also called a test cross — it lets you determine whether an unknown dominant-phenotype individual is BB or Bb based on the offspring ratios.
Homozygous Dominant × Heterozygous (BB × Bb)
Half the cells are BB, half are Bb. All four offspring show the dominant phenotype — you can’t distinguish BB from Bb just by looking. You’d need a test cross to tell them apart.
Beyond the Basic 2×2 — Dihybrid Crosses
When two traits are tracked simultaneously, the Punnett square scales up to 4×4 (16 cells). Each parent’s gametes carry one allele from each gene, so a parent of genotype BbYy can produce four kinds of gametes: BY, By, bY, by. Lay these out on both axes and fill in the 16 combinations.
For BbYy × BbYy (both parents heterozygous for both genes), the resulting phenotypic ratio is the classic 9:3:3:1 — 9 offspring with both dominant phenotypes, 3 with first dominant only, 3 with second dominant only, 1 with both recessive. This is Mendel’s law of independent assortment in action: the two genes segregate independently (provided they’re on different chromosomes or far apart on the same chromosome).
Limitations of the Punnett Square
The Punnett square works cleanly for simple Mendelian inheritance but has real limitations.
- Linked genes on the same chromosome don’t assort independently. Their inheritance depends on the distance between them and the probability of crossing over.
- Incomplete dominance (e.g., red × white snapdragons produce pink) gives 1:2:1 phenotypic ratios, not 3:1.
- Codominance (e.g., AB blood type) shows both alleles in the phenotype.
- Multiple alleles (e.g., three alleles for ABO blood type: I^A, I^B, i) make the table more complex.
- Polygenic traits (height, skin color) involve many genes and produce continuous distributions rather than discrete ratios.
- Epistasis means one gene’s expression depends on another gene’s allele state.
- X-linked inheritance requires separate male/female columns because males have only one X chromosome.
For all these cases, the Punnett square is the wrong tool. But for the single-gene, two-allele, autosomal-dominant case that introductory biology focuses on, it’s the cleanest visual you can use.
The Probability Interpretation
Each cell in a Punnett square represents an equally likely outcome — assuming the parents produce equal numbers of each type of gamete and fertilization is random. For Bb × Bb, the probability of any given offspring being BB is 1/4, Bb is 2/4 = 1/2, bb is 1/4. The Punnett square is just a visual way to multiply independent probabilities.
The same answer comes from the product rule of probability: P(B from parent 1) × P(B from parent 2) = 1/2 × 1/2 = 1/4 for BB; P(BB) + P(Bb) + P(bB) = 1/4 + 1/4 + 1/4 = 3/4 for any genotype with at least one B. The Punnett square is the geometric form of this calculation.
Related study notes: Mitosis, Nucleic Acid, Protein, Venn Diagram.
Frequently Asked Questions
What is a Punnett square used for?
A Punnett square is a 2D grid that predicts the genotype and phenotype ratios of offspring from a known parental cross. It is the standard visual tool for teaching Mendelian inheritance — given the genotypes of both parents, the square shows every possible combination their offspring can have.
How do you set up a 2×2 Punnett square?
Write Parent 1’s two alleles across the top, one above each column. Write Parent 2’s two alleles down the left side, one to the left of each row. Then fill each cell with the combination of the column allele and the row allele. The four cells show the four possible offspring genotypes.
What does the 3:1 ratio mean in genetics?
The 3:1 phenotypic ratio is the classic result of crossing two heterozygous parents (Bb × Bb) for a single trait with simple dominance. Three out of four offspring show the dominant phenotype (BB or Bb), one shows the recessive (bb). This is the ratio Mendel observed in his pea-plant experiments and the foundation of classical genetics.
What is the difference between genotype and phenotype?
Genotype is the specific genetic makeup written as letters — BB, Bb, or bb. Phenotype is the observable trait that results — for a B = purple, b = white gene with simple dominance, both BB and Bb produce purple flowers, only bb produces white. Different genotypes can produce the same phenotype.
What is a test cross?
A test cross is a cross with a homozygous recessive individual (bb), used to determine whether an unknown dominant-phenotype individual is homozygous (BB) or heterozygous (Bb). If the offspring are all dominant-phenotype, the unknown parent was BB. If half show the recessive phenotype, the unknown was Bb.
Can a Punnett square handle two genes at once?
Yes, but the square becomes 4×4 (16 cells) instead of 2×2. Each parent’s gametes carry one allele from each gene, so a BbYy parent produces four kinds of gametes (BY, By, bY, by). The classic BbYy × BbYy dihybrid cross gives the famous 9:3:3:1 phenotypic ratio. For three or more genes, the squares get unwieldy and probability calculations are usually faster.