Venn Diagram
A Venn diagram is a visual representation of sets and the logical relationships between them. Introduced by the English logician John Venn in 1880, the diagram makes set operations easy to see: the union, the intersection, the difference, the complement. The same diagram explains probability events, database queries, classification problems, and Boolean logic. This study note walks through the core operations, the algebra of sets, three-set Venn diagrams, and the practical applications that make the diagram more than a school-textbook exercise.
What a Venn Diagram Is
A Venn diagram represents sets as overlapping circles (or other simple closed curves) inside a rectangle. The rectangle represents the universal set \( U \) — the collection of all elements under discussion. Each circle represents a subset of \( U \). Regions where circles overlap represent elements that belong to multiple sets at once. Regions outside all circles but inside the rectangle represent elements in \( U \) that belong to none of the named sets.
Formally, a set \( A \) is just a collection of distinct objects, called its elements, written \( A = \{a_1, a_2, a_3, \ldots\} \). Two sets are equal if they have exactly the same elements. The empty set, written \( \emptyset \) or \( \{\} \), has no elements at all.
The Five Core Set Operations
Every set operation can be read off a Venn diagram by shading the appropriate region.
Union: \( A \cup B \)
The union of \( A \) and \( B \) contains every element that is in \( A \), in \( B \), or in both. Formally:
$$ A \cup B = \{x : x \in A \text{ or } x \in B\} $$
Example: if \( A = \{1, 2, 3\} \) and \( B = \{3, 4, 5\} \), then \( A \cup B = \{1, 2, 3, 4, 5\} \). Note that 3 appears only once — sets don’t have duplicates.
Intersection: \( A \cap B \)
The intersection contains only the elements common to both sets:
$$ A \cap B = \{x : x \in A \text{ and } x \in B\} $$
Continuing the example: \( A \cap B = \{3\} \). When two sets share no elements, their intersection is the empty set and the sets are called disjoint.
Set Difference: \( A \setminus B \) (or \( A – B \))
The set difference is everything in \( A \) that is not also in \( B \):
$$ A \setminus B = \{x : x \in A \text{ and } x \notin B\} $$
For our example: \( A \setminus B = \{1, 2\} \) and \( B \setminus A = \{4, 5\} \). Set difference is not symmetric.
Complement: \( A’ \) (or \( A^c \) or \( \overline{A} \))
The complement of \( A \) (with respect to the universal set \( U \)) is everything in \( U \) that is not in \( A \):
$$ A’ = U \setminus A = \{x \in U : x \notin A\} $$
If \( U = \{1, 2, 3, 4, 5, 6, 7, 8, 9, 10\} \) and \( A = \{1, 2, 3\} \), then \( A’ = \{4, 5, 6, 7, 8, 9, 10\} \).
Symmetric Difference: \( A \triangle B \)
The symmetric difference is everything in either set but not in their intersection:
$$ A \triangle B = (A \cup B) \setminus (A \cap B) = (A \setminus B) \cup (B \setminus A) $$
For our example: \( A \triangle B = \{1, 2, 4, 5\} \). The symmetric difference is the exclusive-or of set membership.
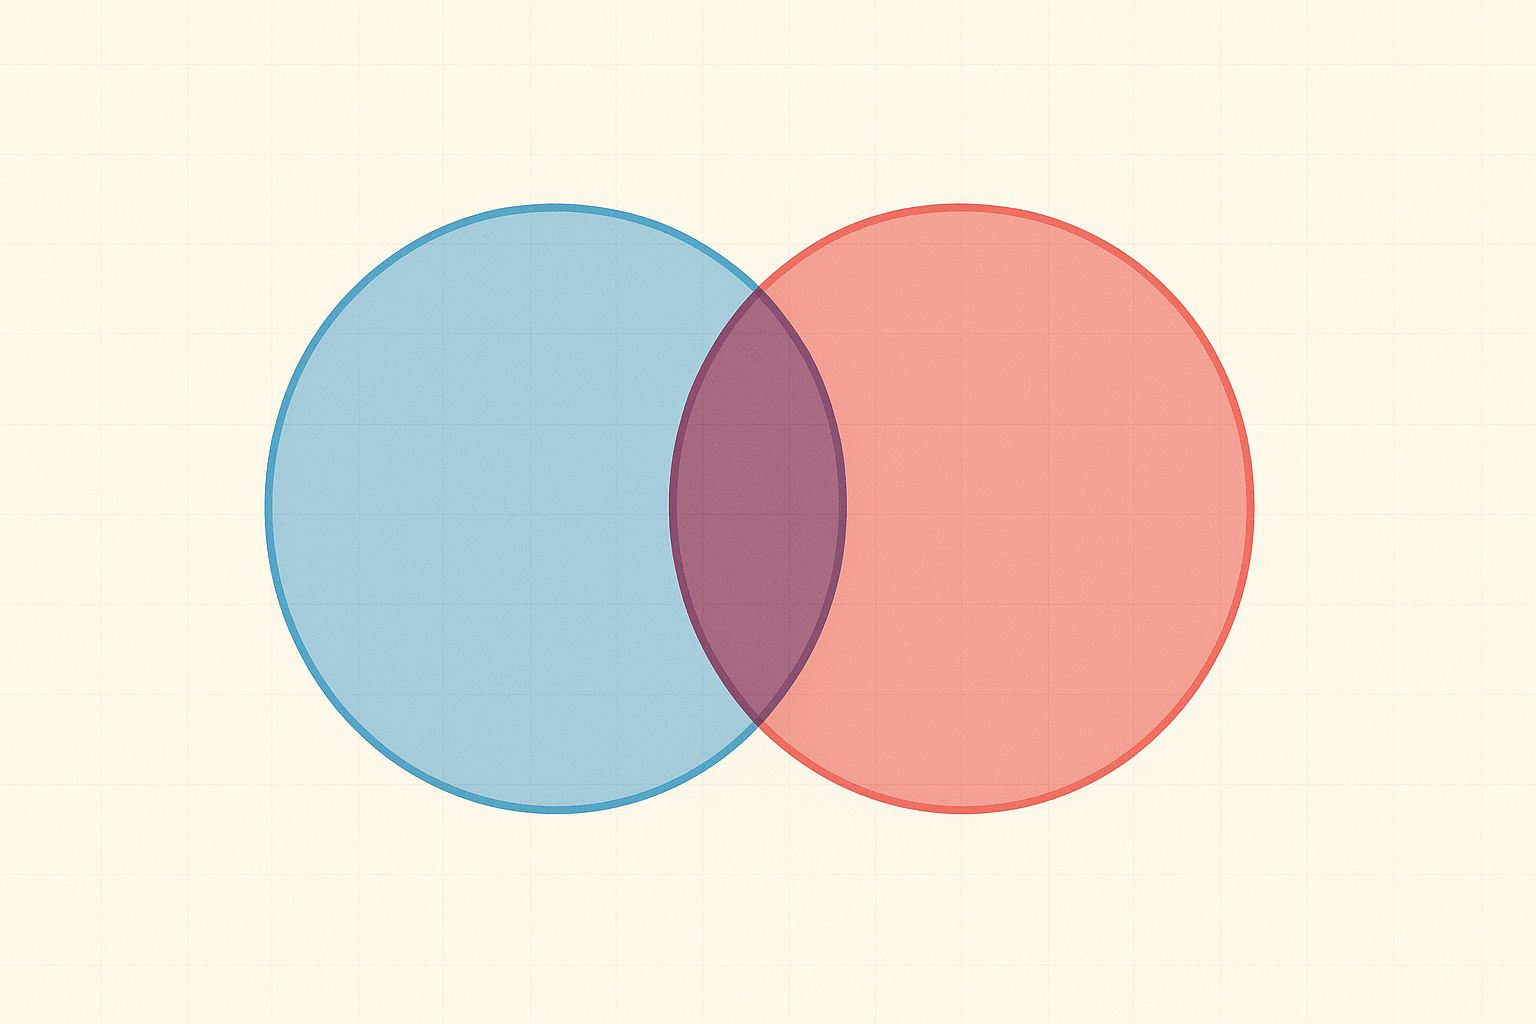
Two-Set Venn Diagrams
A two-set Venn diagram divides the plane into four regions: outside both circles, inside A only, inside B only, and inside both. That gives exactly four mutually exclusive categories any element of the universal set can fall into. The cardinality formula (size of the union) is:
$$ |A \cup B| = |A| + |B| – |A \cap B| $$
This is the inclusion-exclusion principle in its simplest form. It generalizes to any number of sets but the formula gets more elaborate with more sets.
Three-Set Venn Diagrams
A three-circle Venn diagram divides the plane into 8 regions (including the outside). Each element of the universal set belongs to exactly one of those 8 regions, classified by whether it is in A, in B, and in C (each yes/no, so 2³ = 8 combinations). The full inclusion-exclusion formula for three sets:
$$ |A \cup B \cup C| = |A| + |B| + |C| – |A \cap B| – |A \cap C| – |B \cap C| + |A \cap B \cap C| $$
You can verify by drawing: each pairwise overlap is double-counted in the first three terms, then subtracted out; the central region is added three times in the first three terms, subtracted three times in the next three, and re-added once at the end. Net contribution: exactly once, which is correct.
The Algebra of Sets
Set operations satisfy a family of identities that look very much like Boolean algebra:
- Commutativity: \( A \cup B = B \cup A \) and \( A \cap B = B \cap A \)
- Associativity: \( (A \cup B) \cup C = A \cup (B \cup C) \) and same for \( \cap \)
- Distributivity: \( A \cup (B \cap C) = (A \cup B) \cap (A \cup C) \) and \( A \cap (B \cup C) = (A \cap B) \cup (A \cap C) \)
- De Morgan’s laws: \( (A \cup B)’ = A’ \cap B’ \) and \( (A \cap B)’ = A’ \cup B’ \)
- Identity: \( A \cup \emptyset = A \) and \( A \cap U = A \)
- Complement: \( A \cup A’ = U \) and \( A \cap A’ = \emptyset \)
These are the same axioms that define a Boolean algebra. Every set-theoretic identity has a Boolean-logic equivalent (replace \(\cup\) with OR, \(\cap\) with AND, \(‘\) with NOT) and vice versa.
Applications of Venn Diagrams
Beyond classroom set theory, Venn diagrams show up in several practical contexts.
- Probability. The probability axioms map directly onto Venn diagrams. For events \( A \) and \( B \): \( P(A \cup B) = P(A) + P(B) – P(A \cap B) \). The Venn diagram is a calculation aid.
- Database joins. SQL inner join corresponds to \(A \cap B\); left outer join corresponds to \(A\); full outer join corresponds to \(A \cup B\); anti-join corresponds to \(A \setminus B\). Many database tutorials introduce joins with Venn diagrams precisely because the mapping is so clean.
- Boolean search. Library catalogues and search engines use Boolean operators (AND, OR, NOT) that map exactly to intersection, union, and complement. The mental model is the Venn diagram of matching documents.
- Categorization and classification. Any taxonomy with multiple overlapping attributes (a customer who is both a Premium subscriber AND a mobile user, for example) is a Venn diagram in disguise.
Related study notes: Set, Function Notation Rules, Permutations and Combinations.
Frequently Asked Questions
What is a Venn diagram in simple words?
A Venn diagram is a picture made of overlapping circles inside a rectangle. The rectangle represents the universal set (everything under discussion); each circle represents a subset; the overlapping regions show elements that belong to multiple subsets at once. It is the standard visual tool for thinking about sets, set operations, and the logical relationships between groups.
What do the overlapping regions in a Venn diagram mean?
The overlapping region between two circles A and B represents the intersection A ∩ B, the elements that are in BOTH sets at the same time. In a three-set Venn diagram, the central region (where all three circles overlap) represents A ∩ B ∩ C. Elements outside all the circles, but still inside the rectangle, belong to the universal set but not to any named subset.
What is the formula for A union B?
|A ∪ B| = |A| + |B| – |A ∩ B|. You add the sizes of A and B but subtract the intersection once because elements in both sets were counted twice. This is the inclusion-exclusion principle in its simplest form, and it generalizes to three or more sets with alternating addition and subtraction terms.
Who invented the Venn diagram?
John Venn, an English logician and mathematician, introduced the diagram in 1880 in a paper titled ‘On the Diagrammatic and Mechanical Representation of Propositions and Reasonings.’ Similar diagrams existed earlier (notably Leonhard Euler’s diagrams from 1768), but Venn’s version became the standard because he insisted that all possible logical combinations be represented as distinct regions.
What are De Morgan’s laws for sets?
De Morgan’s laws say (A ∪ B)’ = A’ ∩ B’ and (A ∩ B)’ = A’ ∪ B’. In words: the complement of a union equals the intersection of complements, and the complement of an intersection equals the union of complements. These two identities let you simplify any complemented set expression and are the set-theoretic versions of De Morgan’s logic laws.
Can a Venn diagram have more than three circles?
Yes, but it gets visually messy. With four sets you need ellipses, not circles, to represent all 16 possible regions. Five-set, six-set, and higher Venn diagrams have been drawn (Anthony Edwards’s spirals are a clever construction) but become hard to read past four sets. For more than four sets, mathematicians usually switch to other tools like Karnaugh maps or just work with inclusion-exclusion formulas directly.