Mean Median Mode
Mean, median, and mode are the three classic measures of central tendency in statistics. Each one answers the question ‘what’s the typical value in this data?’ but they answer it differently. Mean is the arithmetic average. Median is the middle value when sorted. Mode is the most frequent value. For a perfectly symmetric distribution they all coincide. For real-world data — which is rarely symmetric — they diverge, and the difference between them reveals important things about the data’s shape and what is going on inside it.
Mean — The Arithmetic Average
The mean is the sum of all values divided by the count of values:
$$ \bar{x} = \dfrac{x_1 + x_2 + \cdots + x_n}{n} = \dfrac{1}{n} \sum_{i=1}^{n} x_i $$
Example: for the dataset {2, 3, 3, 4, 7, 7, 7, 8, 9}, sum = 50, count = 9, mean = 50/9 ≈ 5.56.
The mean is the most-used measure of central tendency and the basis of nearly all parametric statistics. It uses every data point. Its main weakness: it is heavily distorted by outliers. A single billionaire in a sample of 100 people from a small town can shift the ‘mean income’ by an absurd amount, while every other person’s life is unchanged.
Median — The Middle Value
The median is the value at the center of the sorted dataset.
- If \( n \) is odd, the median is the \( \dfrac{n+1}{2} \)-th value.
- If \( n \) is even, the median is the average of the two middle values: the \( n/2 \)-th and the \( (n/2)+1 \)-th.
For our dataset {2, 3, 3, 4, 7, 7, 7, 8, 9} (already sorted, n = 9), the median is the 5th value: 7.
The median is the right measure when the data has outliers or is heavily skewed. House prices, household incomes, medical lab values that follow a long-tail distribution — these are reported as medians, not means, because the median resists outliers. Half the data is below, half above, no matter what the extremes do.
Mode — The Most Frequent Value
The mode is the value that appears most often in the dataset.
For {2, 3, 3, 4, 7, 7, 7, 8, 9}, the mode is 7 — it appears three times.
A dataset can have:
- One mode (unimodal) — the simplest case.
- Two modes (bimodal) — two values tied for most frequent. Often a hint that the data combines two underlying populations.
- More than two modes (multimodal) — same logic, more groups.
- No mode — every value appears equally often.
The mode is the only measure of central tendency that works for categorical data (e.g., the most common eye color in a survey is ‘brown’ — you cannot take a ‘mean’ of eye colors). For numeric data, the mode is less useful than mean or median unless the data is grouped or you specifically want to know the most popular value.
When the Three Measures Differ
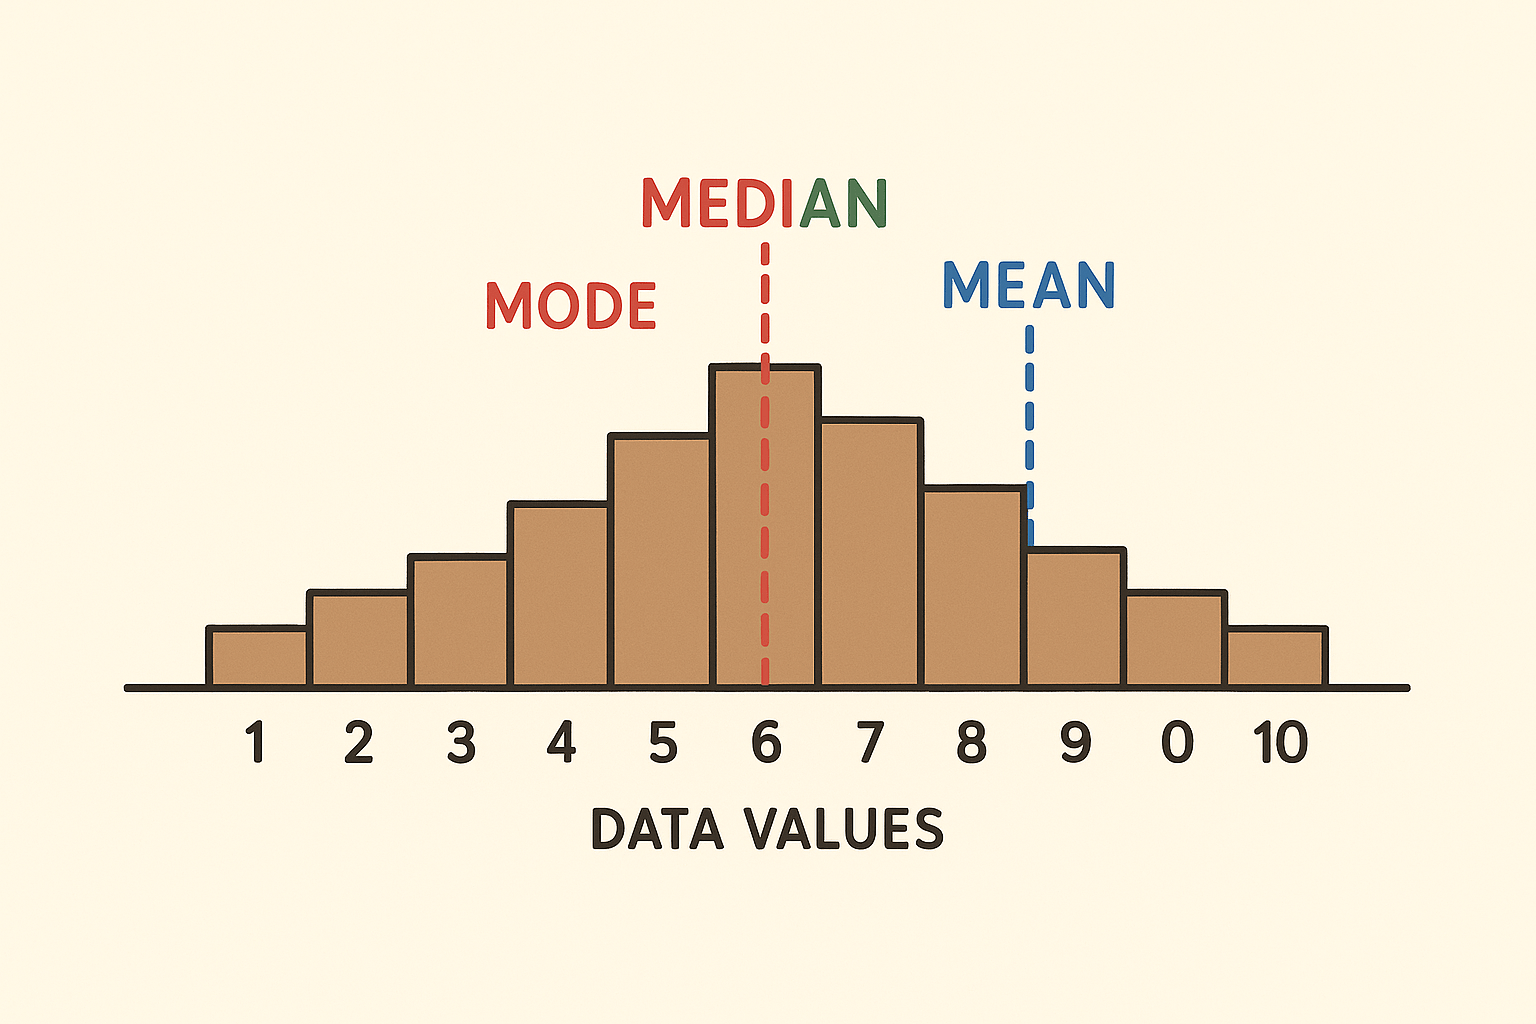
The relative position of mean, median, and mode tells you about the shape of the distribution:
- Symmetric distribution (normal/bell-shaped): mean = median = mode. All three coincide at the center.
- Right-skewed (positively skewed): a tail extending to the right (a few high outliers). Mode < median < mean. The outliers pull the mean to the right of the median.
- Left-skewed (negatively skewed): a tail extending to the left (a few low outliers). Mean < median < mode. The outliers pull the mean to the left.
Quick check: if the mean is much higher than the median, the data has high-value outliers. If lower, low-value outliers. The gap between mean and median is one of the simplest, most useful diagnostic numbers in statistics.
Which One Should You Report?
Rules of thumb that hold in most situations:
- Symmetric, no outliers, numeric data: report the mean. It is the most powerful statistic, uses every data point, and underlies most further analysis.
- Skewed data or data with outliers: report the median. It represents the typical value without being thrown off by extremes. Always report median income, median house price, median survival time.
- Categorical data or interested in most popular value: report the mode. ‘The most common eye color in our sample is brown.’
- Best practice: when in doubt, report all three plus the standard deviation. Readers can interpret the data themselves.
Weighted Mean
Sometimes data points have different weights. A student’s GPA is a weighted mean of course grades, with weights equal to credit hours. A weighted mean is calculated as:
$$ \bar{x}_w = \dfrac{\sum_{i=1}^n w_i x_i}{\sum_{i=1}^n w_i} $$
Where each \( x_i \) is multiplied by its weight \( w_i \) before summing. If all weights are equal, the weighted mean reduces to the ordinary mean.
Related study notes: Normal Distribution, Variance and Standard Deviation, Expected Value, Central Limit Theorem.
Frequently Asked Questions
What is the difference between mean, median, and mode?
Mean is the arithmetic average (sum divided by count). Median is the middle value when the data is sorted. Mode is the most frequent value. Each answers ‘what’s typical’ differently — mean uses every data point, median resists outliers, mode highlights the most popular value. For symmetric data they coincide; for skewed data they diverge.
When should I use the median instead of the mean?
Use the median when the data has outliers or is skewed. Income, house prices, response times, survival durations are almost always reported as medians because the means get distorted by extreme values. The median is the central value that half the data is below and half is above, regardless of what the extremes do.
Can a dataset have more than one mode?
Yes. A bimodal distribution has two modes, a multimodal distribution has more. Multiple modes often indicate that the data is a mix of two or more underlying populations. For example, the distribution of human adult heights is roughly bimodal because it combines male and female height distributions, which have different means.
How do I find the median when there’s an even number of values?
Sort the data, then take the average of the two middle values. For example, with eight values, sort them and average the 4th and 5th. For an odd count, the median is just the single middle value at position (n+1)/2.
What does it mean when the mean is higher than the median?
The data is right-skewed (positively skewed). That means there are some high outliers pulling the mean upward while the median stays at the center of the bulk of the data. Income distributions are the classic example — most people earn near the median, but a few very-high earners pull the mean above the median.
Is the mode useful for continuous data?
Less useful, because continuous data rarely has exact repeated values. Instead, statisticians talk about the modal interval (the bin in a histogram with the highest frequency) or the mode of the underlying probability density function (the value at which the density is highest). For categorical or grouped data, the mode is straightforward.