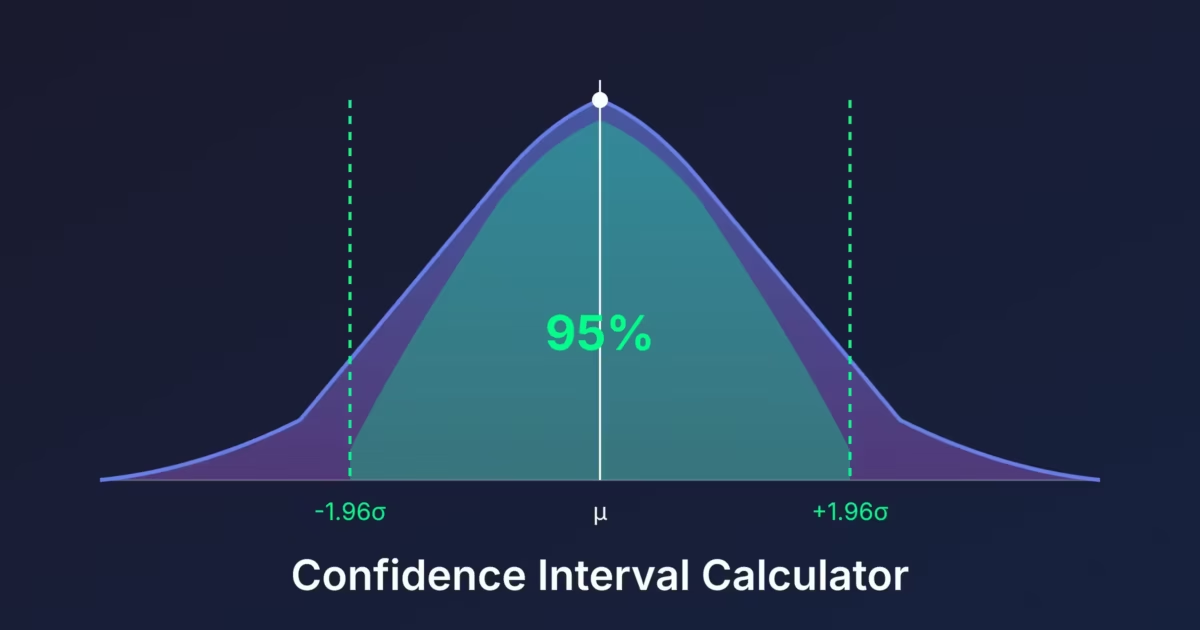
Confidence Interval Calculator
Calculate confidence intervals for means and proportions.
Confidence Interval
Interpretation
Formula Used
What is a Confidence Interval?
A confidence interval provides a range of plausible values for an unknown population parameter based on sample data. Instead of giving a single estimate, it quantifies the uncertainty in your estimate.
The interval has the form: point estimate ± margin of error
Confidence Level
The confidence level (commonly 90%, 95%, or 99%) represents how often the interval would contain the true parameter if we repeated the sampling process many times.
A 95% confidence interval does NOT mean there’s a 95% probability the parameter is in the interval. It means 95% of similarly constructed intervals would contain the parameter.
Types of Confidence Intervals
Z-Interval (\( \sigma \) known)
When the population standard deviation is known:
$$ \bar{x} \pm z^* \cdot \frac{\sigma}{\sqrt{n}} $$
T-Interval (\( \sigma \) unknown)
When using the sample standard deviation:
$$\bar{x} \pm t^* \cdot \frac{s}{\sqrt{n}}$$
The t-distribution has heavier tails, giving wider intervals to account for the extra uncertainty.
Proportion Interval
For estimating population proportions:
$$\hat{p} \pm z^* \cdot \sqrt{\frac{\hat{p}(1-\hat{p})}{n}}$$
Critical Values
| Confidence | \( z^* \) | \( t^* \) \(df=29\) |
|---|---|---|
| 90% | 1.645 | 1.699 |
| 95% | 1.960 | 2.045 |
| 99% | 2.576 | 2.756 |
Factors Affecting Interval Width
Sample Size
Larger samples give narrower intervals (\( \sqrt{n} \) in the denominator).
Confidence Level
Higher confidence requires wider intervals.
Variability
More variable data gives wider intervals.
Interpreting the Interval
- Correct: “We are 95% confident that the true population mean is between 45 and 55.”
- Incorrect: “There is a 95% probability that the population mean is between 45 and 55.”
The parameter is fixed (not random). The interval either contains it or doesn’t.
Sample Size Determination
To achieve a desired margin of error ( E ):
$$n = \left( \frac{z^* \cdot \sigma}{E} \right)^2$$
Double the precision requires four times the sample size.
Assumptions
For Mean Intervals
- Random sample
- Normal population OR large sample (\( n \geq 30 \))
- For t-interval: no extreme outliers
For Proportion Intervals
- Random sample
- \( np \geq 10 \) and \( n(1-p) \geq 10 \) (success/failure condition)