The Simple Math Behind Long Term Growth
Here’s the whole secret to long-term growth in one line: time, a steady rate, and consistent contributions beat picking winners. You don’t need to find the next hot stock. You need to start early, keep adding money, and leave it alone while compound interest does the heavy lifting.
I’m not a financial advisor, and this isn’t financial advice. But I’ve run these numbers for my own savings, for my business reserves, and for friends who asked me to “just show me the math.” The math is simple, and once you see it, you stop second-guessing the boring plan. Put $500 a month into a low-cost index fund earning roughly 8% a year, and after 30 years you’d have about $745,000, of which only $180,000 came out of your pocket.
The proof, up front. I built the chart below from a standard compound-interest formula, not a guess. $500/month at 8% compounded monthly for 30 years = $745,180. Total contributions: $180,000. Growth from compounding: $565,180. That means roughly 76% of your final balance is money you never deposited. You can reproduce every number here with any compound interest calculator.
Table of Contents
What Compound Interest Actually Is
Compound interest is interest earning interest. Your balance grows on your original deposit and on every bit of growth that came before. Simple interest pays you only on the principal. Compound interest pays you on the principal plus all the accumulated returns, which is why the power of compounding shows up as a curve, not a straight line.
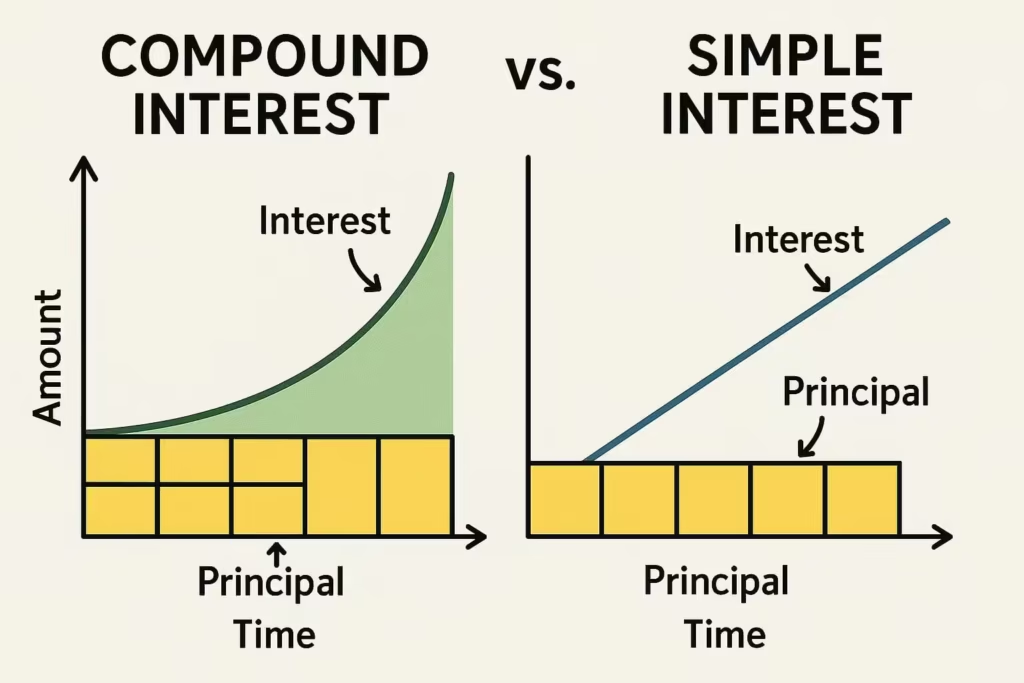
The formula is short. Future value equals your principal times (1 plus the rate) raised to the number of periods, or A = P(1 + r)^n. Add monthly deposits and you’re stacking a second engine on top: each contribution starts its own compounding clock the moment it lands. Here’s a worked example with real numbers so you can check the math yourself.
| Scenario | Starting deposit | Rate | Years | Final value |
|---|---|---|---|---|
| Lump sum, no additions | $5,000 | 6% | 15 | $11,983 |
| Lump sum + $100/month | $5,000 | 6% | 15 | $41,065 |
| Rate effect (low) | $10,000 | 5% | 20 | $26,533 |
| Rate effect (higher) | $10,000 | 7% | 20 | $38,697 |
Look at the bottom two rows. A two-point jump in rate, from 5% to 7%, adds more than $12,000 over 20 years on the same $10,000, with zero extra deposits. That’s the rate doing the work. Now look at row two: adding just $100 a month nearly quadruples the lump-sum result. That’s consistency doing the work. Long-term growth comes from both levers, and you control more of them than you think.
The Rule of 72: Compounding Math You Can Do in Your Head
The rule of 72 tells you how long money takes to double. Divide 72 by your annual rate, and you get the number of years. At 8%, your money doubles in 72 ÷ 8 = 9 years. The exact figure is 9.0 years, so the shortcut is dead-on at common rates. It’s the fastest way to sanity-check any growth claim without opening a spreadsheet.
| Annual rate | 72 ÷ rate | Years to double | Doublings in 36 years |
|---|---|---|---|
| 4% | 72 ÷ 4 | 18 years | 2x → 4x |
| 6% | 72 ÷ 6 | 12 years | 3 doublings → 8x |
| 8% | 72 ÷ 8 | 9 years | 4 doublings → 16x |
| 12% | 72 ÷ 12 | 6 years | 6 doublings → 64x |
That last column is the part that breaks people’s intuition. Over 36 years, an 8% return doubles your money four times, turning $1 into $16. A 12% return doubles it six times, turning $1 into $64. The rule of 72 makes the cost of a low rate, or the gift of a high one, something you can feel in your gut.
Why Starting Early Beats Saving More
Time matters more than the amount. The classic two-savers example proves it, and it’s the single most convincing piece of math I’ve ever shown anyone. Meet two people, both earning 7% a year, both putting in $300 a month while they contribute.
| Saver A (early) | Saver B (late) | |
|---|---|---|
| Contributes | Age 25 to 35, then stops | Age 35 to 65, never stops |
| Years contributing | 10 years | 30 years |
| Total deposited | $36,000 | $108,000 |
| Balance at 65 | $421,453 | $365,991 |
Read that again. Saver A put in $36,000 and walked away after 10 years. Saver B put in three times as much, $108,000, and kept going for 30 years. Saver A still ends up with $55,000 more. The only difference is a 10-year head start. Those early dollars had four decades to compound, and nothing Saver B did later could catch up. This is why “I’ll start investing when I earn more” is the most expensive sentence in personal finance. If you want the deeper how-to, my beginner’s guide to investing in stocks walks through opening that first account.
Contributions vs. Returns: Which Does the Work
In the early years, your contributions do almost all the work. In the later years, the returns do. The chart below maps exactly when the crossover happens for a $500-a-month plan at 8% over 30 years. Watch the red section, growth from compounding, overtake the gray section, your own deposits.
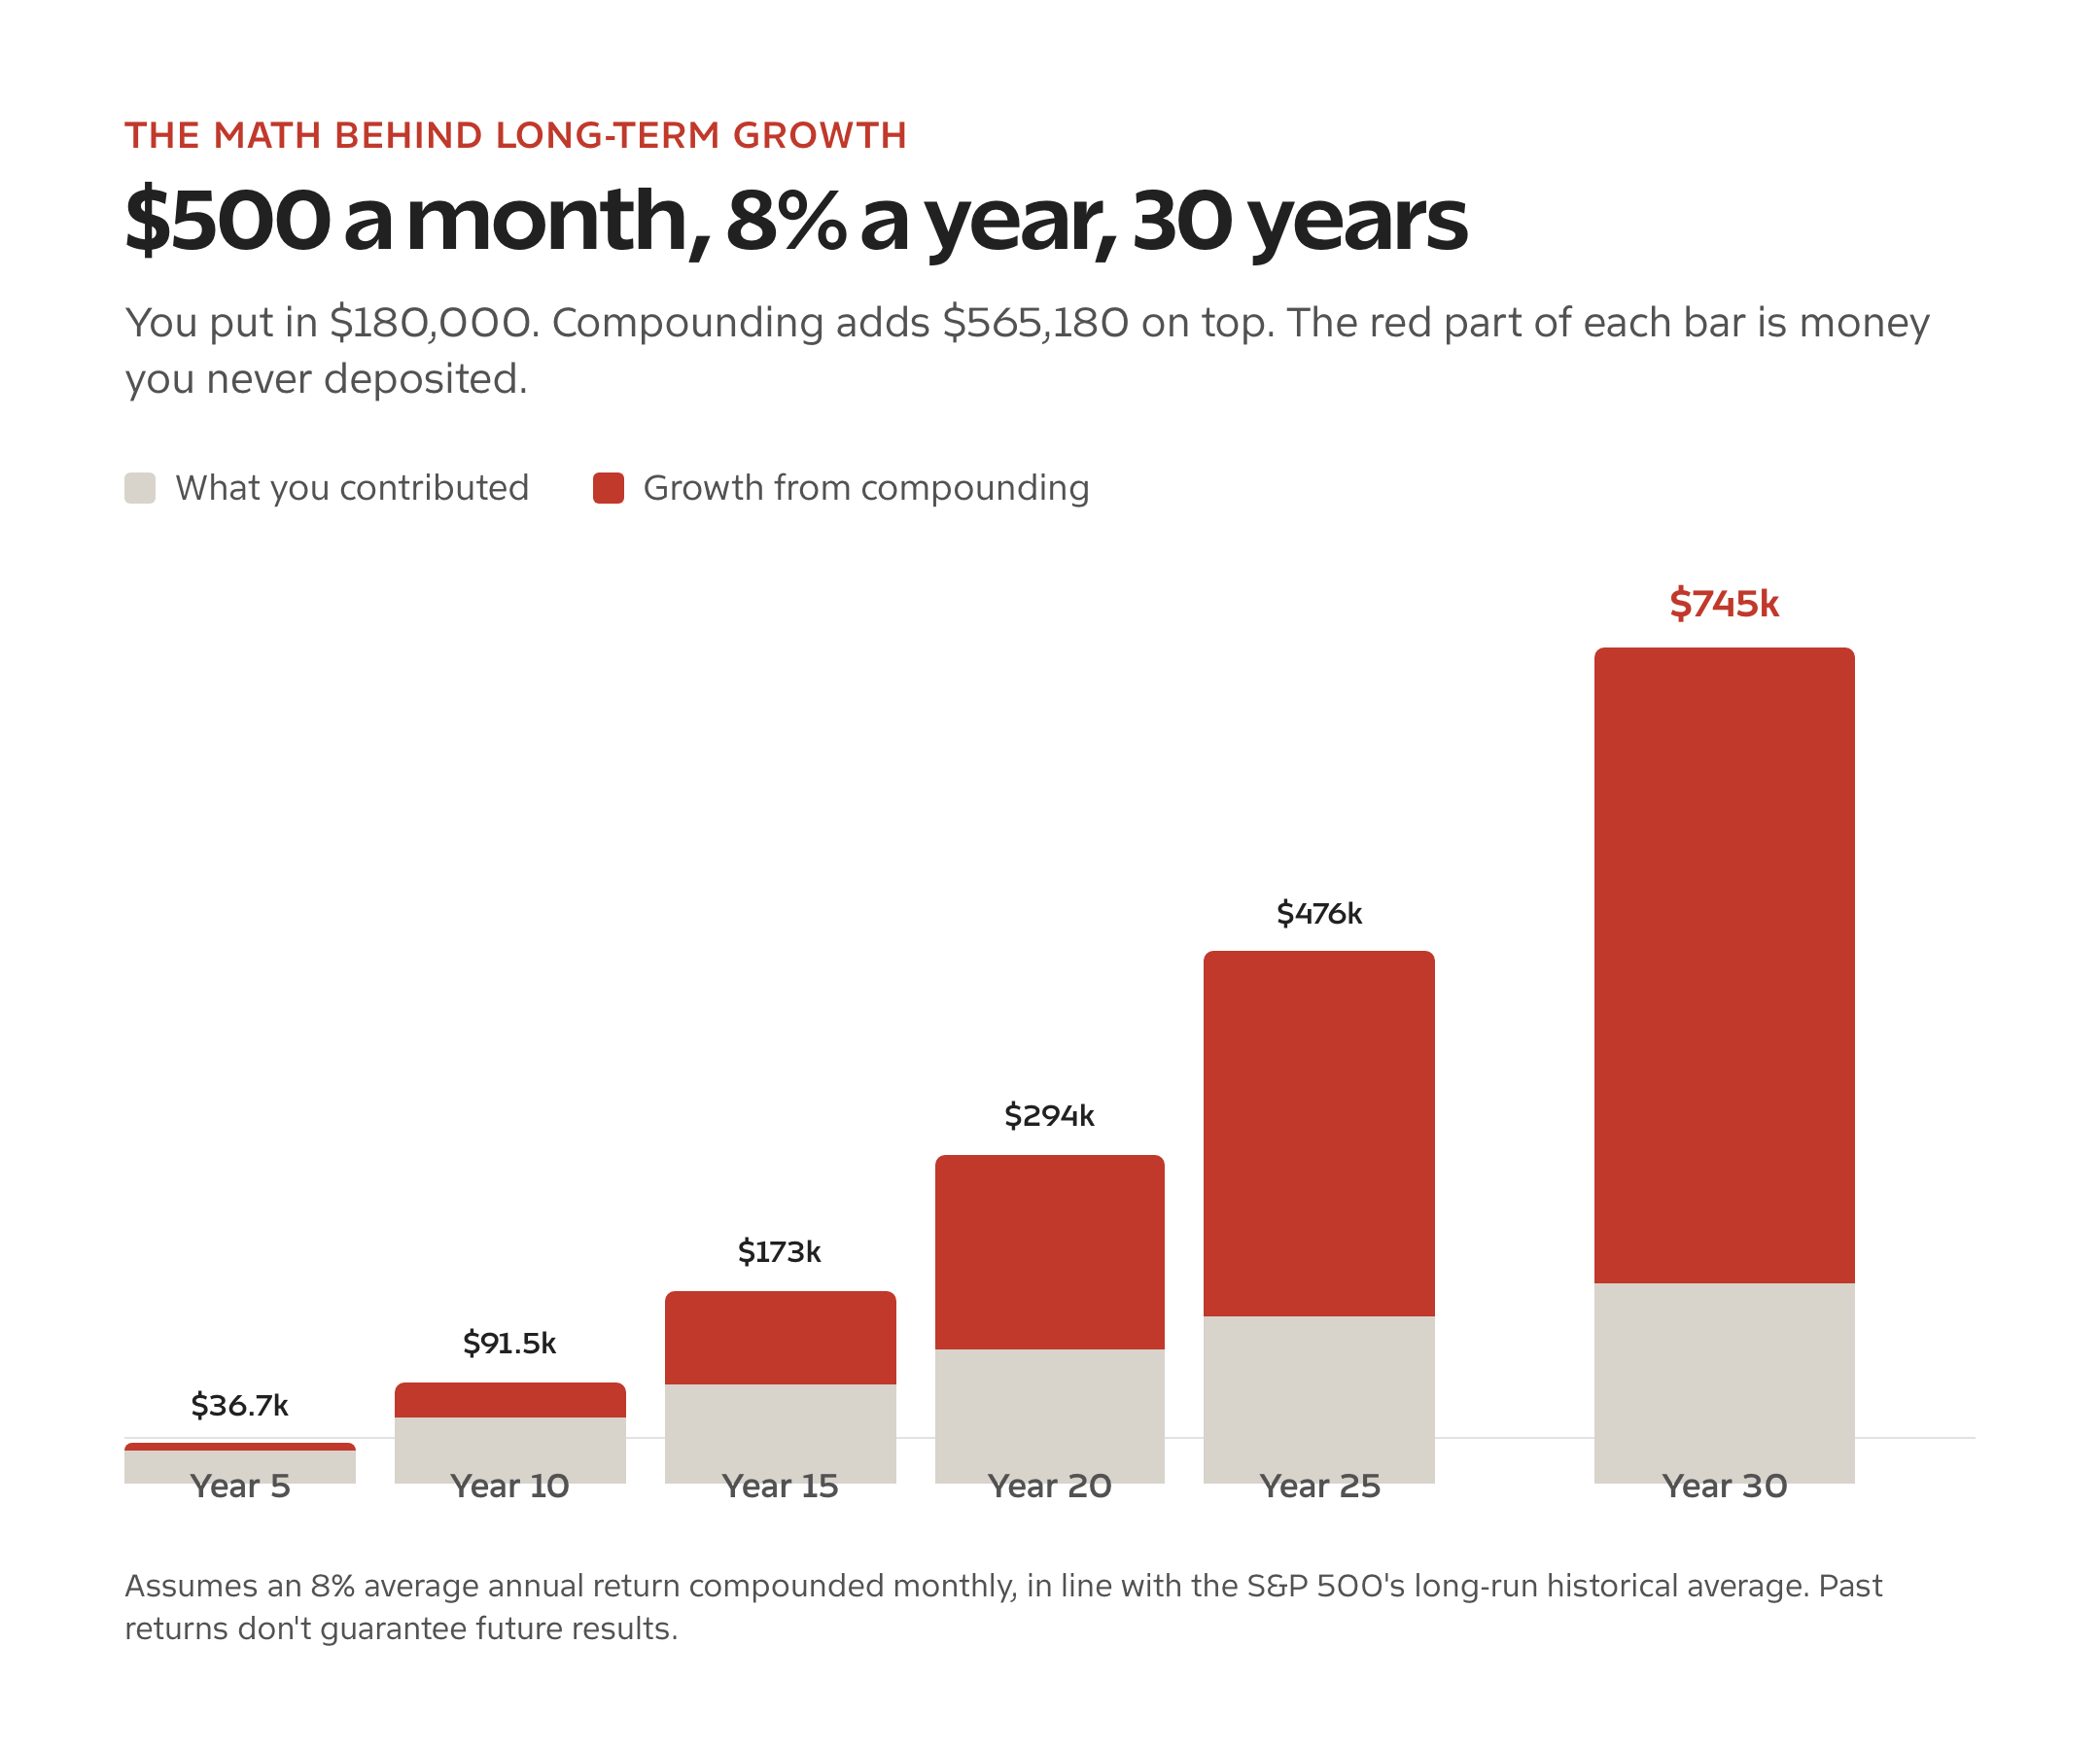
At year 5, you’ve put in $30,000 and have about $36,700. Compounding has barely shown up. By year 20, your $120,000 in deposits has become $294,000, and growth is now the bigger half of the bar. By year 30, you’ve deposited $180,000 and hold $745,000. The growth alone, $565,180, is more than three times everything you contributed. The lesson is brutal and freeing at once: the first decade feels slow because it is slow, and quitting then throws away the only thing that makes the rest work.
This is also why automation beats willpower. When deposits leave your account before you can spend them, you keep the contribution engine running through the boring years. I cover the mechanics of setting that up in my framework on how to balance your budget so the monthly transfer never feels like a sacrifice.
Fees and Inflation: The Drag Nobody Charts
Every chart you see, including mine, shows the gross number. Real life shaves two things off the top: fees and inflation. Both compound against you the same way returns compound for you, so small percentages turn into large gaps over decades.
Take fees first. A fund charging 1% a year instead of 0.05% doesn’t cost you 0.95% once. It costs you 0.95% of a growing balance every year for 30 years. On a $745,000 outcome, that gap can quietly eat well over $150,000. This is the entire case for low-cost index funds: the cheapest way to keep more of the compounding is to stop paying someone to take it.
Then inflation. If your money grows 8% and prices rise 3%, your real growth is closer to 5%. Your $745,000 will buy what roughly $307,000 buys today. That’s not a reason to stop. It’s a reason to keep your money invested rather than sitting in cash, because cash loses the inflation race every single year while a diversified portfolio at least has a fighting chance to outrun it.
How to Apply This: Index Funds and SIPs
The practical version of all this math is boring on purpose: buy a low-cost, broad-market index fund and feed it automatically every month. In the US that’s an S&P 500 or total-market index fund. In India the same idea runs through a SIP, a systematic investment plan, into an index or diversified equity fund. The 8% assumption I used isn’t a sales pitch, it’s roughly the S&P 500’s long-run historical average annual return. Future returns could be lower, and past returns don’t guarantee anything.
Here’s the order I’d follow.
- Set a specific goal and timeline. “Retirement in 30 years” beats “get rich.”
- Pick a low-cost index fund or SIP. Compare expense ratios, not last year’s returns.
- Automate the contribution so it leaves on payday, before you can spend it.
- Increase the amount whenever your income rises, even by $50.
- Check it once a quarter at most. Compounding works while you ignore it.
If you’re choosing a fund in India, my breakdown of the best mutual funds in India covers index and diversified options worth a SIP. And if your finances still feel scattered, the five finance steps to get your life together is a good place to build the foundation before you automate anything.
The Behavioral Part: Not Selling
The math only works if you stay invested through the ugly years, and there will be ugly years. The market drops 20%, 30%, sometimes more, and every instinct screams to sell. Selling locks in the loss and, worse, breaks the compounding chain you spent years building. The two-savers example falls apart the moment either saver cashes out in a panic.
I treat downturns as the price of admission, not a malfunction. The 8% long-run average already includes crashes, recessions, and bad decades. Selling during a dip is the one reliable way to turn a temporary paper loss into a permanent one. The single most valuable financial skill isn’t picking investments. It’s doing nothing while the world panics. Keeping an emergency fund separate from your investments is what lets you sit still, because you never have to sell at the bottom to cover a surprise bill.
Who This Math Fails For
Compounding is powerful, not magic, and it’s the wrong first move for some people. Be honest about where you stand before you automate a 30-year plan.
- You carry high-interest debt. A credit card at 22% compounds against you faster than any index fund compounds for you. Kill that debt first. Paying it off is a guaranteed 22% return.
- You have no emergency fund. If a car repair forces you to sell investments at a loss, the math breaks. Build three to six months of expenses in cash before you lock money up.
- Your time horizon is short. Compounding needs years, ideally decades. Money you’ll need in two or three years doesn’t belong in volatile assets, full stop.
- You’ll panic-sell. If you know you can’t watch a balance drop 30% without bailing, a lower-volatility mix you can actually hold beats a higher-return one you’ll abandon.
For everyone else, the conclusion is the same one I started with. Time, a steady rate, and consistent contributions. Start with whatever you can automate today, raise it when you can, and then get out of the way. The boring plan, run for long enough, is the one that quietly turns $180,000 into three-quarters of a million dollars. That’s the simple math behind long-term growth, and it’s been hiding in plain sight the whole time.