
 by
by
Why projects fail is rarely a mystery and almost never one dramatic mistake. Failure usually begins when scope, economics, dependencies, and decision rights stop matching the plan. The deadline slip is only the visible symptom.
Here is my stance: do not manage a project by asking whether the team is busy. Manage it by asking whether the latest forecast still produces the promised benefit at an acceptable cost and risk. When that answer changes, re-baseline, reprice, reduce scope, or stop. Quietly spending the remaining buffer is not recovery.
The practical verdict: the most dangerous project failure mode is unpriced change. A new requirement changes labor, schedule, dependencies, and expected benefit, but the team keeps the old budget and date. The worked model below turns that drift into a visible decision threshold.
The numbers behind project failure
There is no defensible universal failure rate. A survey of project professionals, a government portfolio, and a space-program assessment measure different things. Read them together for pattern and scale, not as interchangeable percentages.
- Complexity changes the risk: PMI’s May 2026 Pulse report says 97% of professionals managed at least one complex project in the prior year. It reports 31% of complex projects failed to deliver their full intended benefits, compared with 13% of projects overall.
- Management effectiveness is associated with a wide performance gap: the same PMI survey reports 88% success for respondents who said they managed complexity effectively, versus 14% among those only slightly effective or ineffective. This is self-reported association, not proof that one practice caused the difference.
- Business understanding tracks with better outcomes: PMI’s 2025 survey of 2,254 project professionals reported 8% failure for the high-business-acumen group versus 11% for everyone else. It also reported 83% versus 78% on business goals, 63% versus 59% on schedule, and 73% versus 68% on budget.
- A red rating is a warning, not a post-mortem: the UK NISTA 2025-26 portfolio contained 189 major projects: 29 green, 109 amber, and 34 red, with 17 outside those three disclosed ratings. NISTA explicitly says red signals urgent delivery issues, not inevitable failure.
- Overruns can be concentrated: the 2025 GAO NASA assessment found four of 18 development projects had more than $500 million in combined annual cost growth and three had schedule delays. Across 53 historical projects, three Artemis projects represented nearly $7 billion, almost half of accumulated overruns.
The limitation matters. PMI’s figures come from respondents estimating project outcomes. NISTA covers unusually large UK government programs. GAO covers NASA projects above a high cost threshold. None of those samples predicts your next website, campaign, or software release. They do show why benefit, cost, complexity, dependencies, and governance need separate controls.
The 7 root causes as a diagnostic model
I would not rank these by fake frequency percentages. Use them as seven tests. A project can fail several at once, and the interaction is usually more damaging than any single cause.
| Root cause | Observable test | Control |
|---|---|---|
| 1. Unclear or shifting requirements | Two stakeholders describe different outcomes or acceptance criteria | One approved brief with in-scope, out-of-scope, owner, measure, and acceptance test |
| 2. Scope creep without re-baselining | Work is added while price, hours, date, and benefit stay unchanged | Cost every change and approve its new baseline before work starts |
| 3. No single accountable owner | A tradeoff waits for a committee or receives conflicting answers | One sponsor owns the decision; consulted people supply evidence |
| 4. Optimistic estimates | The estimate has no comparable history, range, or dependency allowance | Reference class, decomposed critical path, range, and calibration log |
| 5. Dependency hell | An external approval, API, vendor, or team can move the delivery date | Named dependency owner, required date, interface test, and alternative path |
| 6. No rollback or contingency plan | The team cannot describe how to reverse or contain a failed release | Test rollback, recovery point, forward-fix path, reserve, and stop condition |
| 7. Communication gaps | Forecast changes reach the sponsor after the decision window closes | Fixed written status, decision log, explicit blocker age, and escalation rule |
Why projects fail: the one failure mode behind the rest
The failure underneath the seven causes is a stale baseline. The approved plan says one thing while the work now contains something else. Requirements changed, an interface grew, labor cost moved, a key person left, or expected revenue weakened, but nobody rebuilt the forecast.
That is why I put economics beside scope. A project can ship every feature and still fail if the benefit no longer justifies the effort. It can also miss an early estimate and still succeed if a transparent re-baseline protects the value. Schedule, budget, scope, benefit, and risk are connected; a recovery decision needs all five.
Root cause 1: unclear or shifting requirements
“Build a customer portal” is not a requirement. It is a topic. A requirement becomes estimable when the user, job, data, permissions, acceptance test, exclusions, and operating constraint are explicit.
- Write the acceptance test before the estimate. If the team cannot state how completion will be verified, the estimate is premature.
- Separate outcome from implementation. “Reduce support handling time” is an outcome. “Build a dashboard” is one proposed intervention.
- Record exclusions. Out-of-scope items prevent forgotten assumptions from returning as “small” additions.
- Version the baseline. Every approved revision needs a date, owner, assumptions, and affected measures.
Root cause 2: scope creep without re-baselining
Scope creep is not simply “more work.” The damaging version is more work without an explicit exchange. A 160-hour change can be sensible when it adds enough revenue or benefit. It is destructive when those hours quietly consume the project’s margin and delay the original outcome.
- Price the change before scheduling it. Show extra labor, non-labor cost, delivery movement, risk, and expected benefit.
- Offer choices. Add and reprice, swap with existing scope, move to a later phase, or reject.
- Protect the decision threshold. The model below shows the exact number of unpriced hours the base case can absorb before missing its 20% margin target.
Root cause 3: no single accountable owner
A project needs consultation from several people but final authority from one sponsor. If two people can independently change priority, neither owns the tradeoff. Delay then hides inside governance.
- Name one accountable sponsor per decision class. Product, budget, risk acceptance, and launch readiness may have different owners, but each decision gets one final name.
- Time-box escalation. A blocked decision needs a response date and a default action.
- Keep evidence beside the decision. Options, cost, benefit, risk, owner, and date belong in the same short record.
The ownership problem is also a management problem. My guide to the qualities of great business managers goes deeper into decision rights and accountability.
Root cause 4: optimistic estimates
An estimate is a forecast under named assumptions, not a promise squeezed into one number. The biggest omissions are usually interface work, review queues, rework, testing, deployment, and time waiting for decisions.
- Use completed comparable work. Start with actual duration and cost from similar projects, then explain the differences.
- Estimate a range. Give the assumptions behind the lower, expected, and upper cases.
- Model schedule logic. The GAO Schedule Assessment Guide emphasizes a valid critical path, reasonable duration estimates, risk analysis, and baseline updates.
- Calibrate. Store every estimate and actual outcome. A team that never measures forecast error cannot improve it.
Root cause 5: dependency hell
A dependency becomes dangerous when it controls the delivery date but has no owner, test, or alternative. “Waiting on the API” is not a plan. It is a critical-path condition.
- Name the interface and the owner. Record what must arrive, in what format, by which date.
- Test the riskiest interface early. A thin end-to-end slice reveals integration assumptions before most of the budget is committed.
- Price the alternative. Manual process, stub, second vendor, or delayed feature. A backup with unknown cost is not yet a backup.
If the binding dependency is capacity or specialist expertise, my guide on when to bring in outside help for software development covers the make-or-buy decision.
Root cause 6: no rollback or contingency plan
Rollback is not a sentence in the launch checklist. It is a tested capability with a recovery point, recovery time, owner, and data consequence. If reversal is impossible, define the forward-fix path and the conditions that make launch unacceptable.
- Rehearse restoration. Verify the backup, command, access, dependency, and elapsed time.
- Protect a visible reserve. Do not hide contingency inside every task and then spend it unnoticed.
- Set stop conditions before sunk cost grows. Benefit floor, margin floor, legal constraint, reliability limit, and latest useful date are measurable kill criteria.
Root cause 7: communication gaps between stakeholders
The problem is not too few meetings. It is information arriving after the decision window. A weekly status is useful only when it shows forecast change, blocker age, decision owner, and the date by which action is needed.
- Report forecast, not activity. “Twelve tasks closed” matters less than the new cost, date, benefit, and confidence.
- Age blockers. A blocker open for six days should look different from one opened this morning.
- Write decisions down. One line with owner, choice, assumptions, and date prevents later reconstruction.
Worked project economics: the 200-hour decision threshold
This fixed-price delivery model shows how to convert scope drift into a decision. It is an example, not an industry benchmark. Replace every assumption with your own contract, loaded labor cost, fixed costs, and target contribution margin.
- Contract revenue: $120,000
- Baseline labor: 1,200 hours × $60 = $72,000
- Non-labor cost: $12,000
- Baseline contribution: $36,000, or 30% of revenue
- Minimum acceptable contribution: $24,000, or 20% of revenue
Contribution formula: revenue – non-labor cost – (baseline hours + unpriced extra hours) × loaded hourly cost.
Threshold: ($120,000 – $12,000 – $24,000) ÷ $60 – 1,200 = 200 unpriced extra hours. Hour 201 pushes the forecast below the 20% margin floor.
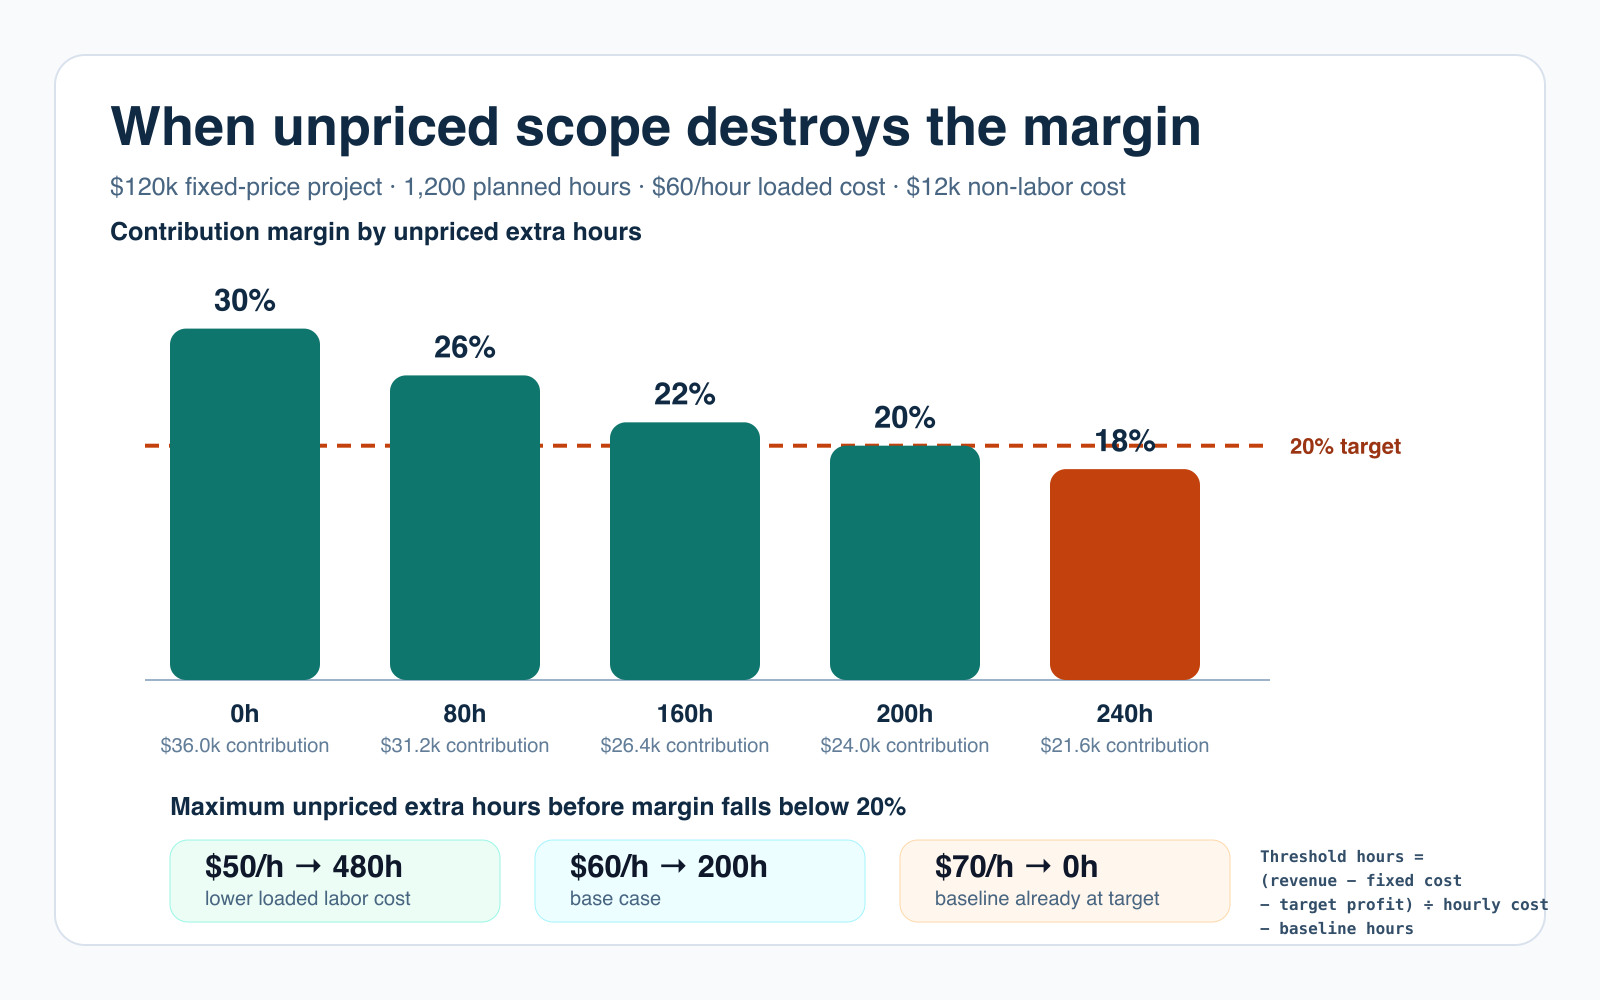
- 0 unpriced hours: $36.0k contribution and 30% margin.
- 80 unpriced hours: $31.2k contribution and 26% margin.
- 160 unpriced hours: $26.4k contribution and 22% margin.
- 200 unpriced hours: $24.0k contribution and 20% margin, exactly at the floor.
- 240 unpriced hours: $21.6k contribution and 18% margin, below the floor.
| Case | Maximum unpriced extra hours at 20% target | Decision |
|---|---|---|
| $50 loaded hourly cost | 480 hours | Cost structure leaves more room, but scope still needs approval |
| $60 loaded hourly cost | 200 hours | Base threshold |
| $70 loaded hourly cost | 0 hours | Baseline already sits exactly at the target |
| $100,000 revenue at $60/hour | -67 hours | The baseline deal already misses the target |
| $140,000 revenue at $60/hour | 467 hours | Higher price creates room, not permission for silent scope |
Price the change: a 160-hour addition costs $9,600. To preserve a 20% contribution margin on that change, the minimum change-order revenue is $12,000 because price – $9,600 = 20% of price. A $15,000 change order adds $5,400 of contribution. The same work left unpriced reduces the original project’s contribution from $36,000 to $26,400.
The model excludes tax, financing, warranty probability, and the client’s cost of delayed benefits. That is deliberate. Start with a small auditable model, then add only variables that change the decision.
Causes and fixes at a glance
Keep this control table next to the project forecast. It turns each diagnosis into one visible action.
| Reason projects fail | Highest-leverage control | Evidence to review |
|---|---|---|
| Unstable requirements | Acceptance criteria and exclusions before estimating | Approved brief and requirement version |
| Unpriced scope change | Cost, price, schedule, benefit, and risk on every change | Change log and current margin forecast |
| No accountable owner | One final owner per decision class | Decision log and overdue decisions |
| Optimistic estimates | Comparable actuals, range, critical path, and calibration | Estimate-versus-actual history |
| Unmanaged dependencies | Owner, required date, interface test, and alternative | Dependency map and blocker age |
| No contingency path | Test rollback or forward-fix plus stop condition | Recovery result and reserve remaining |
| Information latency | Forecast-led status and dated escalation | Time from risk discovery to sponsor decision |
Capacity and sequencing can make or break several of these controls. My resource allocation in software projects guide shows how to expose the binding queue instead of spreading people across everything.
Recovery framework for projects already failing
Recovery starts by stopping the fiction. Do not add people, overtime, or another tool until the team can state the current economics and critical path.
- Freeze new scope long enough to measure. Keep safety and incident work moving, but stop optional additions.
- Reconstruct actual state. Delivered acceptance tests, cost to date, forecast cost, earliest credible date, remaining benefit, dependencies, and risks.
- Find the binding constraint. One decision, interface, skill, queue, or assumption usually controls the near-term forecast.
- Present choices with consequences. Cut scope, add funded capacity, move the date, reprice, change the solution, or stop.
- Get written sponsor approval. The new baseline needs an owner and acceptance date.
- Track leading evidence. Blocker age, forecast margin, critical-path movement, escaped defects, and benefit tests are more useful than percent complete.
The GAO Cost Estimating and Assessment Guide treats the estimate as a living process: define scope, build the estimate, analyze risk and uncertainty, document it, present it, and update it with actual costs and changes. That is the recovery discipline in one sentence.
If the failing project is the business itself, not one delivery, the same logic applies at a larger scale. My guide for when a small business is struggling to take off focuses on contribution, cash runway, and the next measurable constraint.
Frequently asked questions
What are the most common reasons projects fail?
Use seven diagnostic buckets: unstable requirements, unpriced scope change, unclear decision ownership, uncalibrated estimates, unmanaged dependencies, no rollback or contingency path, and slow or distorted stakeholder information. They overlap, so do not assign a project to only one cause.
What percentage of projects fail?
There is no universal project failure rate because definitions and portfolios differ. PMI’s 2026 survey reported that 31% of complex projects failed to deliver their full intended benefits, versus 13% for projects overall. Treat those as survey estimates, not a law for your organization.
Why do project estimates overrun?
An estimate can miss scope, interfaces, queue time, review, testing, deployment, and uncertainty. Use completed comparable work, decompose the critical path, express a range, and record estimate versus actual so the next forecast is calibrated.
When should a project be re-baselined?
Re-baseline when an approved change alters scope, cost, schedule, benefits, risk, or the critical path enough that the current baseline no longer supports an honest forecast. Make the changed assumptions and sponsor decision visible.
How do you recover a failing project?
Stop adding work, reconstruct the current cost and benefit forecast, identify the binding constraint, and present explicit choices: cut scope, add funded capacity, move the date, reprice the work, or stop. Resume only after the sponsor accepts a new baseline and decision rights.
Tell Google you want more of this.
Add Gaurav Tiwari as a preferred sourceOne tap, and this site shows up more often in your own Top Stories, AI Overviews and AI Mode. Remove it any time.