
 by
by
Conversion rate optimization is the discipline of increasing useful outcomes without damaging revenue quality, user trust, or retention. Start with the page where a decision is made, define one primary metric and at least one guardrail, then test a specific hypothesis against a control.
A higher conversion rate is not automatically a better business result. A discount can increase purchases while reducing gross profit. A shorter form can increase leads while lowering lead quality. CRO works only when the experiment measures the outcome that pays the business and the side effect that could make the apparent win unsafe.
The method is straightforward: diagnose friction, write a falsifiable hypothesis, size the test, randomize traffic, check instrumentation, read the confidence interval, and ship only when the primary metric and guardrails support the decision.
The practical CRO rule is to remove uncertainty before adding persuasion. Make the offer, price, next step, privacy cost, and error state clear. Then measure whether the change helps real users complete the task.
Microsoft’s experimentation teams run thousands of controlled tests each month across products such as Bing, Edge, and Teams. Their published guidance emphasizes randomization, sample-ratio mismatch checks, and guardrail metrics. Apply that discipline to each step of your conversion funnel. It is a better model than copying a benchmark or declaring a winner after a few good days.
A controlled CRO example with the decision math exposed
This is a modeled A/B test, not a client case study. The hypothesis is that a clearer checkout summary will increase completed orders. The primary metric is purchase conversion. Revenue per visitor is the guardrail because the variant may change order value.
| Metric | Control | Variant | Read |
|---|---|---|---|
| Visitors | 10,000 | 10,000 | Randomized 50/50 |
| Purchases | 300 | 360 | +60 purchases |
| Conversion rate | 3.0% | 3.6% | +0.6 percentage points; +20% relative |
| Average order value | $78 | $72 | -7.7% guardrail movement |
| Revenue per visitor | $2.34 | $2.592 | +10.8% |
- Observed absolute lift: 0.6 percentage points.
- 95% confidence interval for the absolute lift: about 0.10 to 1.10 percentage points.
- Two-sided p-value: about 0.0175 under the standard large-sample proportion test.
- Pre-test planning: about 13,914 visitors per variant would target 80% power for a 3.0% to 3.6% change at a 5% two-sided significance level.
- Instrumentation check: investigate sample-ratio mismatch before trusting any result.
I would not ship this variant on conversion rate alone because average order value fell. Revenue per visitor still increased by about 10.8%, so the result remains promising, but margin, refunds, and repeat purchase should be checked before a permanent rollout. If those guardrails worsen, the conversion win is the change I would not ship.
What Is Conversion Rate Optimization?
Conversion rate optimization (CRO) is the process of increasing the percentage of website visitors who take a desired action. That action could be a purchase, a form submission, a newsletter signup, or clicking a specific button. CRO uses data analysis, user behavior insights, and controlled testing to improve how your website performs without spending more on ads.
Think of it this way. You’re paying for every visitor who lands on your site, whether through Google Ads, organic SEO, or social media. If only 2 out of 100 visitors convert, you’re wasting 98% of your acquisition spend. CRO fixes that ratio.
The term gets thrown around loosely, but real CRO isn’t just changing button colors. It’s a systematic approach that combines tools like Google Analytics 4 (GA4) for quantitative data, Hotjar for qualitative heatmaps, and A/B testing platforms like VWO or Optimizely to validate hypotheses before committing to changes.
Do not use a sitewide rate to justify a redesign. Track the decision path by page, device, source, new versus returning user, and conversion type. A 1.2% lead rate from cold search traffic and a 1.2% purchase rate from returning email subscribers are not comparable outcomes.
How to Calculate Conversion Rate (The Formula)
The conversion rate formula is straightforward. Divide the number of conversions by the total number of visitors, then multiply by 100 to get a percentage.
Conversion Rate = (Number of Conversions / Total Visitors) x 100
If your WooCommerce store gets 10,000 visitors in a month and 250 of them make a purchase, your conversion rate is 2.5%. Simple math, but the nuances matter.
Here’s where most people mess up. They calculate one sitewide conversion rate and call it a day. That’s useless. You need to track conversion rates for specific actions and specific pages. Your e-commerce product pages will have a different conversion rate than your blog posts. Your pricing page should convert differently than your homepage.
In GA4, you set these up as “key events” (Google renamed conversions to key events in March 2024). Each key event tracks a specific action: purchase completed, form submitted, demo requested. You can then see conversion rates by traffic source, device type, landing page, and user segment.
The formula is the same for every action, but each action needs its own denominator, audience, and decision rule.
- E-commerce store: 500 orders from 20,000 visitors = 2.5% conversion rate
- SaaS free trial: 120 signups from 3,000 landing page visitors = 4.0% conversion rate
- Lead gen form: 80 submissions from 1,500 visitors = 5.3% conversion rate
- Newsletter signup: 200 subscribers from 8,000 blog readers = 2.5% conversion rate
Track each one separately. The aggregate number hides the real story.
What Is a Good Conversion Rate by Industry?
A good conversion rate is the rate that improves the business outcome for a comparable audience without breaking a guardrail. Industry averages mix different traffic sources, devices, offers, price points, and definitions of conversion. Use them to frame a question, not to set a target.
Instead of copying an industry number, define a comparable slice. Keep the traffic source, device, offer, audience, and conversion definition stable, then choose the business metric and guardrail that belong to that flow.
| Benchmark slice | Keep constant | Primary metric | Guardrail |
|---|---|---|---|
| E-commerce checkout | Traffic source and device | Purchase conversion | Revenue or margin per visitor |
| SaaS trial | Plan and audience | Activated trial rate | Retention or support load |
| Lead generation | Offer and form | Qualified lead rate | Sales acceptance rate |
| Newsletter | Page and audience | Confirmed signup rate | Unsubscribe or spam rate |
| Booking flow | Service and geography | Completed booking rate | Cancellation rate |
A few things to note from this table. Finance and legal services convert higher because the visitor intent is typically very strong. Someone searching for “car insurance quote” or “divorce lawyer near me” is ready to act. E-commerce tends to be lower because a lot of traffic is just browsing.
Do not obsess over a universal average. If you are optimizing a Shopify store, compare the same traffic source, device mix, offer, and time window. Segmenting the baseline often reveals that one weak checkout step or one device class is hiding inside the sitewide rate.
The CRO Process: Where to Start
Effective CRO follows a repeatable process: collect data, form hypotheses, prioritize tests, run experiments, and analyze results. Skip any step and you’re guessing, not optimizing. It also pays to know when to ship a tiny tweak versus a bold redesign, which is exactly what I break down in optimizing web design for conversions. Here’s the process I use with every client project.
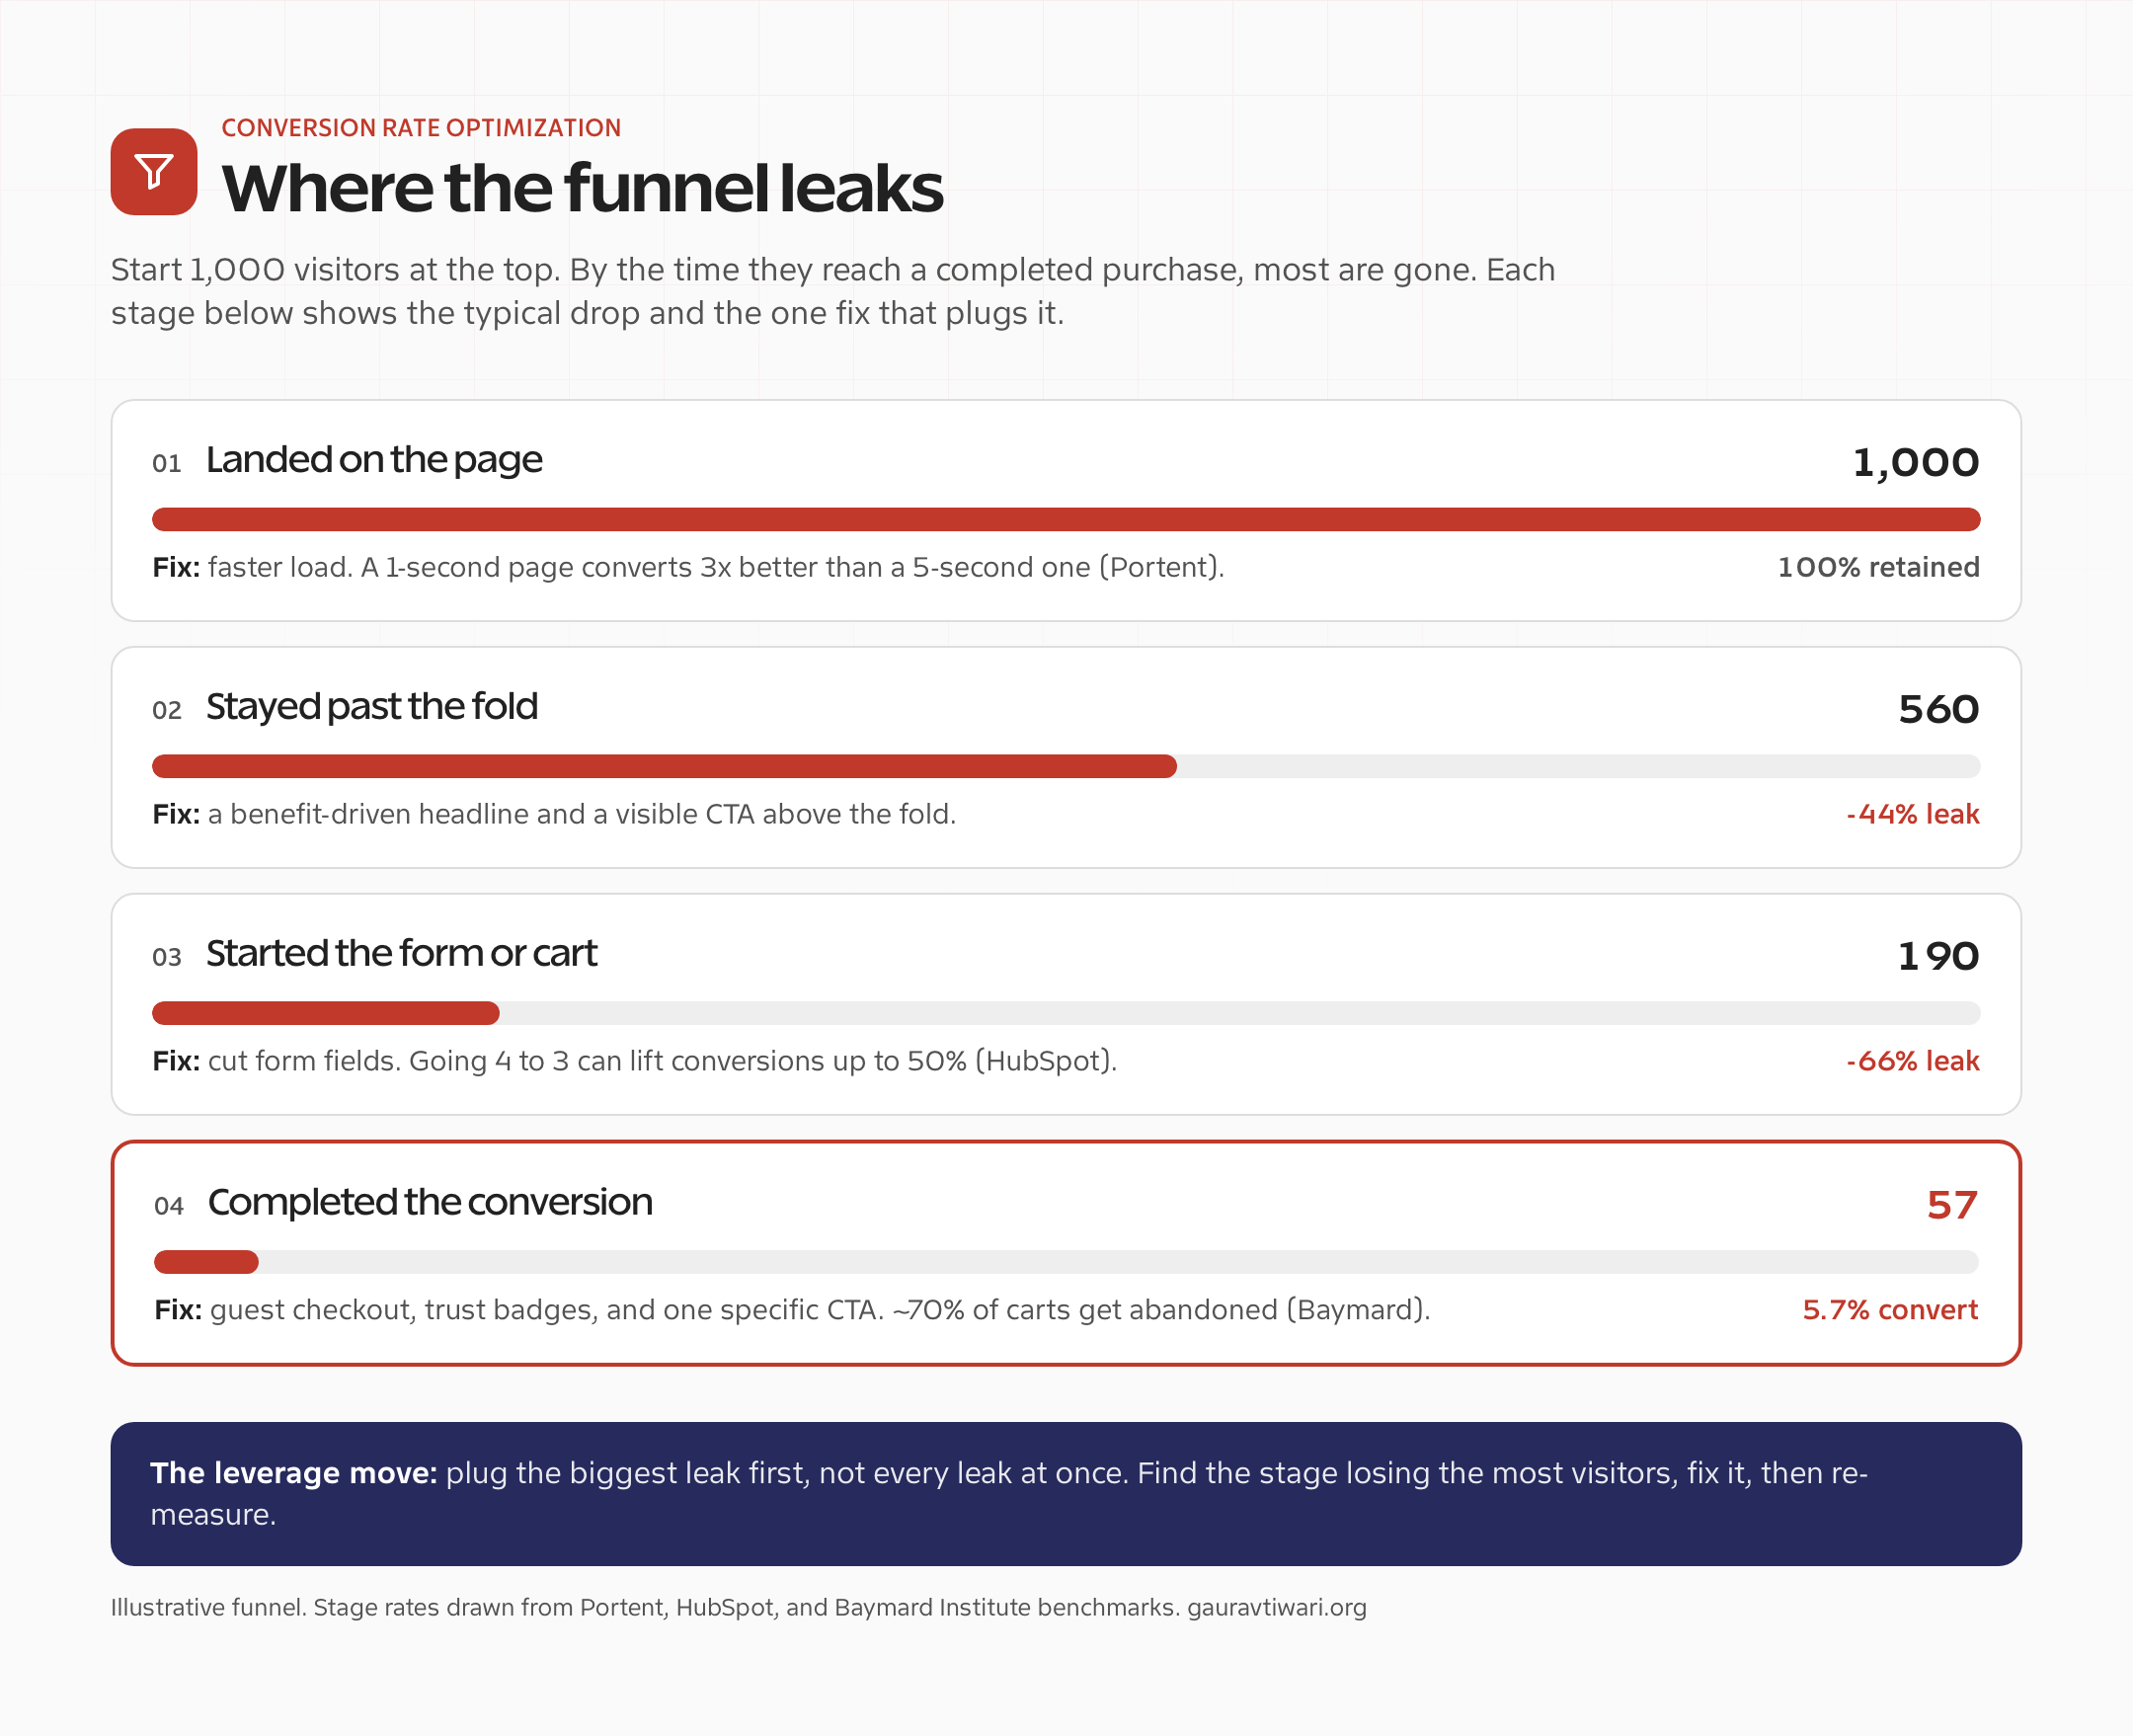
Before you fix anything, it helps to see where visitors actually leak out of your conversion funnel. This is the picture I sketch for every client on day one. Start 1,000 people at the top, and watch how few reach the finish line.
Step 1: Collect Quantitative Data
Start with GA4. Look at your funnel reports to find where visitors drop off. Check your landing page reports to see which pages have the highest bounce rates. Look at device breakdowns, because mobile and desktop conversion rates are often wildly different.
Key metrics to pull from GA4:
- Conversion rate by landing page
- Bounce rate by traffic source
- Average engagement time per page
- Funnel drop-off points (checkout steps, form fields)
- Device and browser performance differences
Step 2: Collect Qualitative Data
Numbers tell you what’s happening. Qualitative data tells you why. This is where tools like Hotjar and Microsoft Clarity come in. Set up heatmaps on your top 10 landing pages. Record user sessions. Run on-site surveys asking visitors why they didn’t complete a purchase.
I once discovered that 34% of users on a client’s checkout page were clicking on the shipping cost area repeatedly. They weren’t trying to select anything. They were confused about whether shipping was included. Adding one line of text (“Free shipping on all orders”) increased checkout completion by 18%.
Step 3: Form Hypotheses and Prioritize
Use the PIE framework to prioritize your tests: Potential (how much improvement is possible), Importance (how valuable is the traffic on this page), and Ease (how simple is the test to implement). Score each hypothesis 1-10 on all three factors.
A hypothesis should look like this: “Changing the CTA button text from ‘Submit’ to ‘Get My Free Quote’ on the contact page will increase form submissions by 15%, because user session recordings show visitors hesitating at the current button.”
Step 4: Run A/B Tests
Google Optimize ended on September 30, 2023, so choose the replacement by testing model, statistics, privacy, traffic, implementation effort, feature flags, and current price. Client-side tools include VWO, Optimizely, AB Tasty, and Convert. Server-side and feature-flag options include GrowthBook, Statsig, and Kameleoon. Microsoft Clarity helps with recordings and heatmaps, but it is diagnostic evidence, not an A/B testing engine.
Set the sample size, minimum detectable effect, duration, primary metric, guardrails, and stopping rule before the test starts. Then run through complete business cycles and inspect the confidence interval, not only a significance flag. If you have never structured a clean experiment, walk through my guide on how to do successful A/B testing before launch.
Step 5: Analyze and Iterate
Document every test, whether it wins or loses. Losing tests are valuable because they tell you what your audience doesn’t respond to. Build a testing knowledge base. After 50+ tests, you’ll have a pattern library specific to your audience that no competitor can replicate.
CRO Tactics That Actually Work
These aren’t theoretical suggestions. Every tactic below has moved the needle on real projects I’ve worked on. Some are quick wins. Others take time. All of them are backed by testing data.
Fix Your CTAs
CTA copy should make the next action and consequence clear. Generic labels can create ambiguity, but a more specific label is still a hypothesis. Test comprehension, conversion, and downstream quality instead of assuming one wording always wins.
Changes I’ve tested that consistently win:
- “Submit” to “Get My Free Audit” makes the outcome clearer, but it still needs a control.
- “Sign Up” to “Join the Weekly Briefing” states the product instead of inventing social proof.
- “Download” to “Send Me the Guide” describes delivery and can reduce uncertainty.
- Keep the promise identical between variants so the test isolates copy rather than changing the offer.
The pattern is clear. First-person language (“My,” “Me”) and specific outcomes beat vague verbs.
Reduce Form Fields
Every field you add to a form reduces your completion rate. HubSpot’s own research shows that reducing form fields from 4 to 3 can increase conversions by up to 50%. I’ve seen similar results. One client had a “Request a Demo” form with 11 fields. We cut it to 4 (name, email, company, phone). Demo requests jumped 67%.
Ask yourself: do you really need their job title, company size, and budget range before the first conversation? You can qualify leads after they’ve converted. Getting them to convert is the hard part.
Add Social Proof Where It Matters
Social proof works, but placement matters more than volume. Don’t dump all your testimonials on a dedicated “Testimonials” page nobody visits. Place them next to your CTAs, on your pricing page, and inside your checkout flow.
The most effective social proof formats I’ve tested:
- Specific numbers: “Trusted by 2,847 companies” beats “Trusted by thousands”
- Named testimonials with photos: 34% more effective than anonymous quotes
- Star ratings near CTAs: Adding a “4.8/5 from 1,200 reviews” badge next to the buy button increased conversions 22% on an e-commerce site I optimized
- Client logos: Work best in B2B. Place them above the fold on your homepage
Fix Page Speed
Page speed can affect whether a visitor sees and completes the flow, but do not convert one published benchmark into a guaranteed lift. Measure load performance, errors, conversion, and revenue on the same release. Google’s Core Web Vitals help describe user-visible performance; the business metric tells you whether the fix mattered.
Quick wins that improve both speed and conversions:
- Switch to a faster WordPress host (I recommend Cloudways or Kinsta for WooCommerce stores)
- Serve images in WebP format using ShortPixel or Imagify
- Remove plugins whose code, requests, or features are unnecessary, after checking dependencies
- Implement proper caching with WP Rocket or FlyingPress
- Lazy load images below the fold
Speed changes should be tested as performance work and as conversion work. Record Core Web Vitals, error rate, checkout completion, and revenue per visitor before and after the release. A faster page can still lose if a script, payment method, or personalization rule breaks.
Simplify Your Checkout Flow
Cart abandonment rates average 70% according to Baymard Institute’s 2025 data. The top reasons are unexpected costs, required account creation, and a checkout process that’s too long. Every extra step in your checkout is a chance for the customer to leave.
If you’re running WooCommerce, enable guest checkout. Add a progress indicator. Show the order summary at every step. Display trust badges (SSL seal, payment icons, money-back guarantee) near the payment button. These aren’t fancy tricks. They’re basics that too many e-commerce sites still get wrong.
For my own projects and most client sites, I use GA4 for tracking, Hotjar for heatmaps and session recordings, and VWO for A/B testing. I run Cloudways for hosting (speed matters for conversions) and WP Rocket for caching. This stack handles everything from a 5-page lead gen site to a 10,000-product WooCommerce store. You don’t need 15 tools. You need the right 4 or 5.
Best CRO Tools Compared
The right CRO tool depends on your budget, traffic volume, and what you’re trying to learn. Here’s an honest comparison of the tools I’ve used across client projects, including what each one does well and where it falls short.
| Tool | Role in CRO | Starting model | Important limit |
|---|---|---|---|
| Google Analytics 4 | Events, funnels, segments | Free standard product | Requires careful event design |
| Hotjar | Heatmaps, recordings, surveys | Limited free and paid tiers | Qualitative evidence, not causal proof |
| VWO | A/B and multivariate testing | Plan-based pricing | Check traffic and feature limits |
| Optimizely | Enterprise experimentation and feature flags | Custom pricing | Complexity and implementation cost |
| Crazy Egg | Heatmaps and recordings | Paid plans and trials | Confirm current quotas |
| Microsoft Clarity | Recordings and heatmaps | Free | Does not replace a controlled test |
| Unbounce | Landing pages and testing | Paid plans and trials | Confirm current plan features |
My recommendation for most businesses: Start with GA4 (free) + Microsoft Clarity (free) + VWO’s free plan. That gives you quantitative analytics, qualitative session recordings, and A/B testing capability for $0/month. You can run a solid CRO program on this stack until you outgrow the free tiers.
If you have budget, add Hotjar’s Business plan ($99/month) for on-site surveys and feedback widgets. The survey feature alone has helped me uncover conversion blockers that no amount of heatmap data would reveal. And if your landing page optimization work involves spinning up dedicated campaign pages fast, Unbounce is the builder I reach for, mostly because its Smart Traffic feature auto-routes visitors to the variant most likely to convert them.
Skip Optimizely unless you’re an enterprise with 1M+ monthly visitors and a dedicated CRO team. It’s powerful, but the pricing and complexity aren’t worth it for small to mid-sized businesses.
Common CRO Mistakes That Kill Conversions
The mistakes below keep appearing because they make a test feel faster: small samples, copied variations, desktop-only review, weak metrics, and early stopping. Each one trades decision quality for speed.
Testing Without Enough Traffic
You need at least 1,000 visitors per variation to get meaningful results from an A/B test. If your page gets 500 visitors a month, running a two-variation test will take 4+ months to reach statistical significance. That’s not CRO. That’s waiting.
If your traffic is too low for A/B testing, skip VWO and focus on qualitative research instead. Use Hotjar session recordings and surveys to identify problems, then make direct changes based on best practices. Test when you have the traffic to support it.
Copying Competitors Instead of Testing
Just because Amazon uses orange buttons doesn’t mean you should. Your audience is different. Your product is different. Your price point is different. What converts for a $29/month SaaS product won’t convert for a $5,000 consulting engagement.
Use competitor sites for inspiration, not imitation. Then test your own variations.
Ignoring Mobile
Mobile and desktop visitors often arrive with different intent, speed, screen size, and input constraints. Segment the baseline before diagnosing a gap. Then inspect tap targets, keyboard behavior, form errors, payment methods, sticky elements, and performance on real devices.
Check GA4 by device class, but do not use a fixed mobile-to-desktop ratio as the diagnosis. Compare traffic mix and flow first. If a material gap remains, reproduce the flow on real devices before writing a test hypothesis.
Optimizing the Wrong Page
Don’t optimize your about page when your pricing page has a 78% bounce rate. Start with the pages closest to the conversion point. For e-commerce, that’s the product page and checkout. For SaaS, it’s the pricing page and signup form. For lead gen, it’s the landing page and contact form.
Use GA4’s funnel exploration report to find where the biggest drop-offs happen. That’s where your CRO effort delivers the highest ROI.
Treating CRO as a One-Time Project
CRO isn’t a project. It’s a process. Your audience changes. Your competitors change. Browser behavior evolves. What worked 12 months ago might not work today. The best marketing strategies treat optimization as an ongoing practice, not a checkbox.
I schedule quarterly CRO audits for all active client sites. Each audit reviews analytics trends, re-records user sessions, and identifies new testing opportunities. It takes about 4 hours per site and consistently finds 2-3 high-impact improvements every cycle.
Who Should Not Obsess Over CRO Yet
Here’s the part most CRO articles won’t tell you, because it sounds bad for business. If your site gets fewer than about 1,000 visitors a month on the page you want to optimize, you have a traffic problem, not a conversion problem. CRO is the wrong fight right now. You simply don’t have the sample size to learn anything trustworthy from a test, and a 0.5 percentage-point “win” on 300 visitors is noise, not insight.
You should hold off on a structured CRO program if any of these describe you:
- Under ~1,000 monthly visitors on your money page. A two-variation A/B test would take months to reach significance. Spend that energy on traffic instead.
- No clear conversion action yet. If you haven’t defined what a “conversion” even is for your site, there’s nothing to optimize. Set that up first.
- A brand-new site or offer. You need a baseline before you can improve it. Ship, gather a few weeks of real data, then optimize.
- A fundamentally broken product or price. No button color fixes an offer people don’t want. CRO amplifies a decent offer. It can’t rescue a bad one.
If that describes your site, the next move is to attract more visitors to your website and repair measurement before running a low-power experiment. You can still interview users, review sessions, test usability, and fix clear errors. Just do not label a handful of conversions statistically valid.
Getting Started With CRO Today
You don’t need a big budget or a dedicated CRO team to start improving your conversion rates. Start small, use free tools, and focus on high-impact pages first.
Here’s a practical 30-day CRO kickstart plan:
Week 1: Set up GA4 key events for your primary conversion actions. Install Microsoft Clarity for free session recordings and heatmaps. Identify your top 5 pages by traffic volume.
Week 2: Review session recordings on those top 5 pages. Watch at least 20 sessions per page. Note where users hesitate, rage-click, or drop off. Write down 3 hypotheses per page.
Week 3: Prioritize hypotheses using the PIE framework. Pick the top 3 and implement the easiest one directly (if traffic is low) or set up an A/B test (if traffic supports it).
Week 4: Monitor results. Document what you learned. Plan the next round of tests. If you’re running a reliable e-commerce website, this monthly rhythm will compound into serious revenue growth over 6-12 months.
CRO is valuable because its decisions can be measured. Improvements do not simply stack forever, and every lift should be rechecked as traffic, offers, and user behavior change. The same discipline matters when the traffic arrives on pages built around high-quality content that ranks: measure the next action, not just the visit.
Frequently Asked Questions
What is a good conversion rate for a website?
A good conversion rate improves the intended business outcome for a comparable audience without breaking a guardrail such as margin, lead quality, refunds, retention, or support load. Use your own segmented baseline and confidence interval instead of a universal industry target.
What is the conversion rate formula?
Conversion rate equals conversions divided by eligible visitors, multiplied by 100. If 300 of 10,000 eligible visitors purchase, the rate is 3.0%. Define the conversion, eligibility rule, audience, and time window before comparing rates.
How long does it take to see results from CRO?
The time depends on traffic, baseline rate, minimum detectable effect, business cycle, and required sample size. Define those before launch and run through complete cycles. Low-traffic sites may learn more from instrumentation repair, interviews, usability tests, and sequential releases than from an underpowered A/B test.
Is Google Optimize still available for A/B testing?
No. Google Optimize and Optimize 360 ended on September 30, 2023. Alternatives include client-side experimentation platforms, feature-flag systems, and server-side tests. Choose by traffic, statistics, implementation model, privacy, integrations, and cost, and verify the current plan limits before committing.
What is the difference between CRO and A/B testing?
A/B testing is one tool within the larger CRO process. CRO (conversion rate optimization) is the complete methodology that includes data collection, user research, hypothesis formation, testing, and analysis. A/B testing is specifically the step where you show two or more variations of a page to different visitors and measure which one converts better. You can practice CRO without A/B testing (using qualitative research and best practices), but you can’t do effective A/B testing without the broader CRO framework to guide what you test and why.
Tell Google you want more of this.
Add Gaurav Tiwari as a preferred sourceOne tap, and this site shows up more often in your own Top Stories, AI Overviews and AI Mode. Remove it any time.