What is Data Onboarding and how to use it in Business?
You’re publishing content every week. You’re checking Google Analytics. You’re sending emails. You’re posting on social media. And yet, when someone asks “which content actually drives revenue?”, you can’t answer with confidence. The data exists. It’s just scattered across six different platforms that never talk to each other.
This disconnect costs you real money. I’ve watched content creators pour hours into articles that get traffic but generate zero revenue, while ignoring the quiet posts that actually drive email signups and affiliate commissions. Without connecting your data sources, you’re making decisions based on fragments. It’s like reading every third page of a book and trying to understand the plot.
Data onboarding solves this. It’s the process of connecting your scattered data sources into one unified view so you can see the full picture. I’m going to walk you through exactly how to set this up for your content business: the 9 data sources you’re already sitting on, the dashboard cadence that takes 15 minutes a week, the GA4 setup most creators skip, and the first-party data strategy that’s worth more than any paid tool. Everything here is what I actually use across my own sites.
What is Data Onboarding?
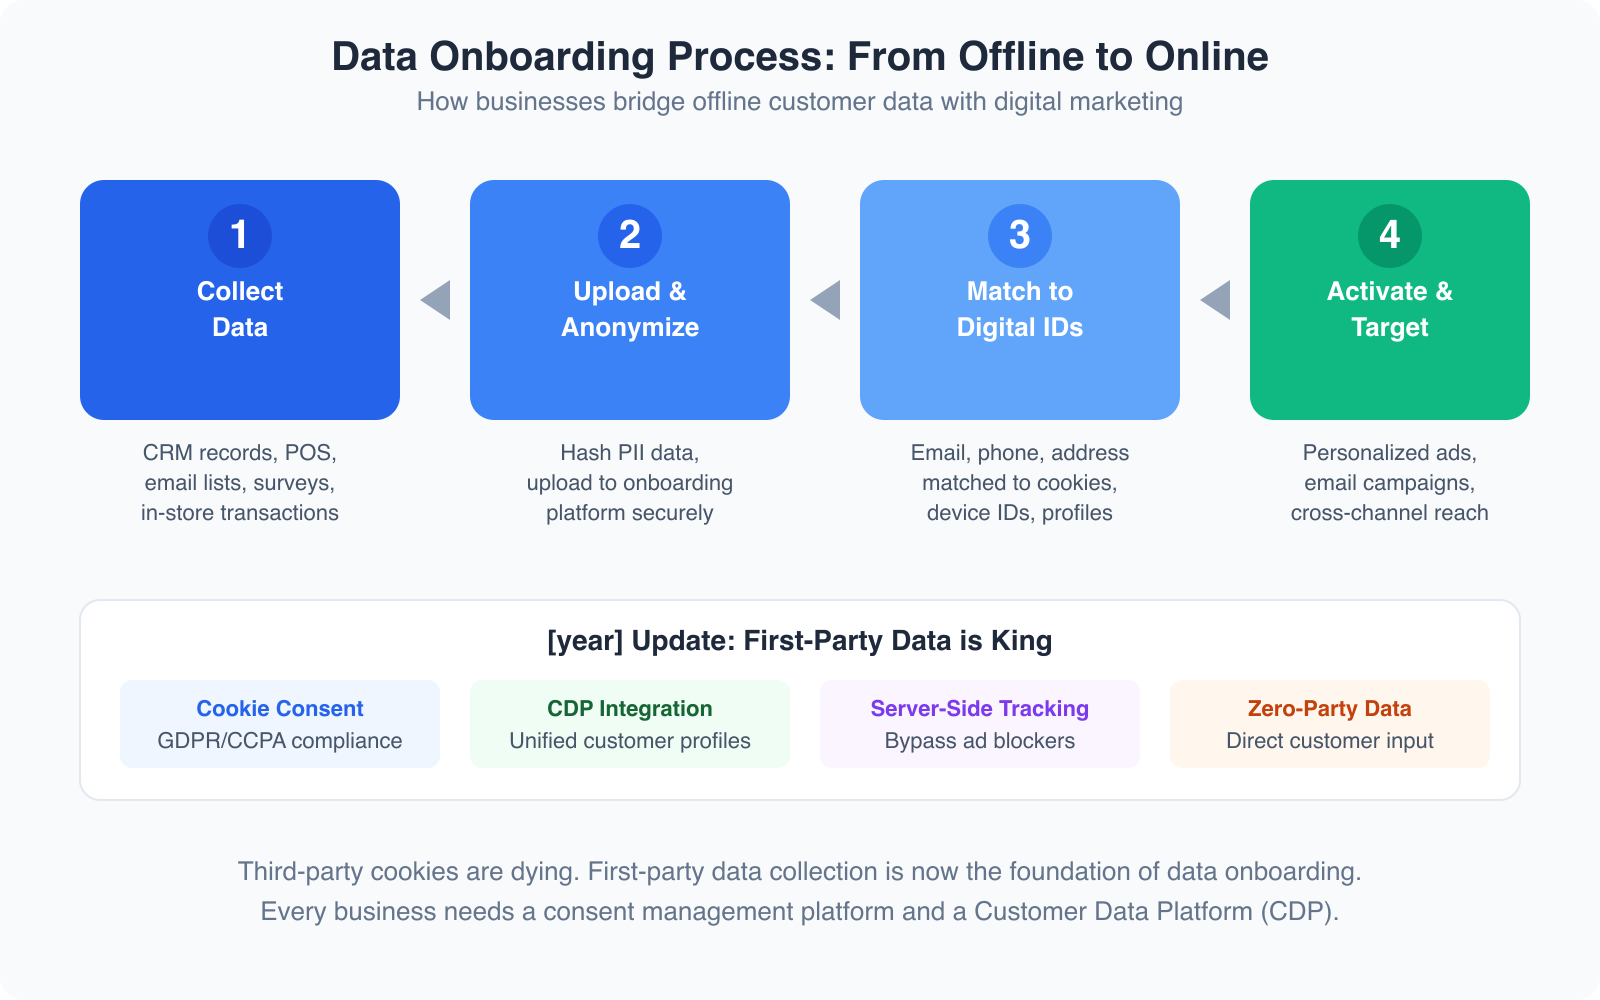
Data onboarding is the process of connecting offline and siloed data sources into a unified digital environment where you can actually use them together. For enterprise businesses, this traditionally meant uploading CRM records and matching them to digital ad profiles. For content creators and small businesses in 2026, it means something more practical: connecting your Google Analytics data with your email subscriber behavior, your social media engagement, and your revenue numbers.
The concept hasn’t changed, but who needs it has. Five years ago, data onboarding was a conversation for companies with six-figure marketing budgets and dedicated data teams. Now, any content creator running a WordPress site with GA4, an email list, and some affiliate partnerships has enough data sources to benefit from connecting them properly.
Here’s the core problem it solves: your email platform knows who opens your emails. Google Analytics knows which pages get traffic. Your affiliate dashboard knows which links earn commissions. But none of these tools know what the others know. Data onboarding bridges those gaps so you can answer questions like “which email subscribers also buy my recommended products?” or “which blog topics attract people who actually convert?”
Data You’re Already Collecting (And Probably Ignoring)
Most content creators are sitting on a goldmine of data they never look at. Before you can onboard anything, you need to know what you already have. I’ve broken this down into the five categories that matter most for content-driven businesses.
Website Analytics (GA4 + Search Console)
Google Analytics 4 tracks every meaningful interaction on your site: page views, scroll depth, outbound clicks, file downloads, video plays, and custom events you define. Google Search Console shows you the other side: which queries bring people to your site, your average position for each keyword, click-through rates, and impression counts. Together, they tell you what content people find (Search Console) and what they do once they arrive (GA4).
The data most creators ignore here is engagement rate. GA4 replaced bounce rate with engagement rate, which measures the percentage of sessions that lasted longer than 10 seconds, had a conversion event, or had 2+ page views. An article with 50,000 page views but a 30% engagement rate is performing worse than one with 5,000 views and an 80% engagement rate. The second one actually holds attention.
Email Platform Data
Your email service provider holds some of the most valuable behavioral data you’ll ever collect. Open rates and click rates are the obvious metrics, but the real insights are deeper. Look at which subscribers never open anything (they’re diluting your metrics), which links get clicked most (those are your audience’s true interests), and what time/day combinations produce the best engagement. I’ve found that segmenting my list by engagement level and sending different content to each segment improved my click rate by 40% in three months.
Social Media Metrics
Every social platform gives you analytics: impressions, reach, engagement rate, profile visits, link clicks, follower demographics. The metric that matters most for content creators isn’t followers or likes. It’s referral traffic. How many people actually click through to your site from each platform? Check your GA4 acquisition reports. You’ll often find that the platform where you have the smallest following drives the most actual traffic. That’s a signal worth acting on.
Revenue Data
If you’re monetizing content, you have revenue data scattered across multiple dashboards. Ad network reports (RPM per page, earnings per session), affiliate platform dashboards (clicks, conversions, commissions per product), course or product sales data, and sponsorship payments. The problem is none of these talk to each other or to your traffic data. You can see that you earned $1,200 from affiliates last month, but you can’t easily see which articles drove those commissions without manually connecting the dots.
CRM and Subscriber Data
If you use any CRM tool, even a simple one like a Google Workspace spreadsheet, you have customer data: who bought what, when they signed up, what lead magnet attracted them, their lifetime value. This data becomes powerful when you connect it to your content analytics. Knowing that subscribers who found you through your “best project management tools” article have 3x the lifetime value of those from your “free templates” post changes your entire content strategy.
Connecting Content Performance to Revenue
This is where data onboarding gets practical. The goal is to answer one question: which content makes money? Not which content gets traffic. Not which content gets shares. Which content puts dollars in your account?
The tool that makes this possible is UTM parameter tracking. Every link you share, whether in an email, social media post, or guest article, should have UTM parameters attached. Google’s free Campaign URL Builder generates these. When someone clicks a UTM-tagged link and later converts, GA4 attributes that conversion to the exact campaign, medium, and source you defined.
I use a simple UTM structure for all my content. Source is the platform (newsletter, twitter, linkedin). Medium is the content type (email, social, guest-post). Campaign is the specific piece of content (march-roundup, tool-review-thread). This lets me see in GA4 exactly which piece of content on which platform drove each conversion.
For affiliate revenue specifically, most networks let you add sub-IDs to your tracking links. I append the article slug as a sub-ID so I can match commission reports back to specific articles. When I ran this analysis last quarter, I discovered that 3 articles out of 200+ generated 60% of my affiliate revenue. Without connecting the data, I’d never have known to update and promote those 3 articles more aggressively.
The Content Creator Data Dashboard
Having data is useless without a regular review cadence. I’ve tested various frequencies and settled on a three-tier system: weekly, monthly, and quarterly. Each serves a different purpose, and the weekly check takes just 15 minutes.
Weekly Check (15 Minutes)
Every Monday morning, I check five things. Traffic snapshot compared to last week (sessions, users, page views). Top 5 performing pages this week. Email metrics from the last send (open rate, click rate, new subscribers). Best social post by engagement. And a quick revenue check across all sources. This isn’t deep analysis. It’s pattern recognition. You’re looking for spikes, drops, and anything unusual. If traffic jumped 40% on Tuesday, find out why. If email opens tanked, check the subject line.
Monthly Review (1 Hour)
Once a month, I go deeper. Full content performance audit with top and bottom 10 pages by traffic and revenue. Keyword ranking changes in Search Console. Email list health including growth rate, churn, and segment performance. Revenue by channel breakdown. And conversion funnel analysis, tracking from traffic to email signup to purchase. This is where you spot trends. Maybe your how-to articles consistently outperform listicles for revenue. Maybe LinkedIn drives more email signups than Twitter despite having fewer followers. These insights shape next month’s content calendar.
Quarterly Deep Dive (3 Hours)
Every quarter, I do a full strategic review. Content ROI analysis with revenue per article and cost per piece. Year-over-year audience growth trends. Topic cluster performance to see which content clusters drive revenue versus just traffic. Revenue diversification analysis to check the ad vs. affiliate vs. product mix. And strategic planning for the next quarter’s content and revenue goals. This is where big pivots happen. Last year, my Q3 review showed that tutorial content earned 4x more per page view than news content. I cut my news output by 50% the next quarter and redirected that effort into tutorials. Revenue went up 35%.
GA4 Setup for Content Creators
GA4 is free and it’s the most powerful analytics tool most content creators underutilize. The default setup tracks basic page views and some events automatically. But the real value comes from custom configuration that most people skip entirely.
Custom Events Worth Tracking
Beyond the automatic events GA4 captures (page_view, scroll, click, file_download), you should set up custom events for actions that matter to your business. I track these: affiliate link clicks (with the destination and article as parameters), email signup form submissions (with the lead magnet name), product purchase clicks, and content sharing actions. Each custom event takes about 5 minutes to set up through Google Tag Manager. The payoff is massive because you can now see exactly which content drives the actions that generate revenue.
Audience Segments That Actually Matter
GA4 lets you create audience segments based on behavior. Most people create segments by demographics, which is nearly useless for content strategy. Instead, create segments based on actions. I use four: converters (people who clicked an affiliate link or signed up), engaged readers (3+ pages per session, 2+ minutes average engagement time), email subscribers (tracked via the signup event), and returning visitors (2+ sessions in the last 30 days). When you compare these segments, you’ll see patterns. Maybe 80% of your converters entered through 10 specific articles. That tells you where to focus optimization efforts.
GA4 Explorations for Content Strategy
The Explore section in GA4 is where the real insights live. Build a funnel exploration that shows: page view to scroll to affiliate click to external site visit. This reveals your content funnel’s leak points. If 10,000 people view a page but only 50 click your affiliate link, you have a content problem, not a traffic problem. I also use the path exploration to see what people do after reading specific articles. If most readers of your “best email tools” article then visit your “email marketing strategy” article, that’s a natural content cluster you should strengthen with internal links.

- Keyword position tracking with daily updates
- Content audit tool scores existing articles
- Competitor traffic and keyword gap analysis
- Site audit catches technical SEO issues
- Backlink analytics and link building tools
- Plans start at $139.95/month with free trial
The most comprehensive SEO and content analytics platform I use daily. Tracks keyword rankings, content performance, competitor analysis, and site health in one dashboard. The Content Analyzer connects search performance directly to your content strategy.
First-Party Data Strategy: Your Email List is Your Most Valuable Asset
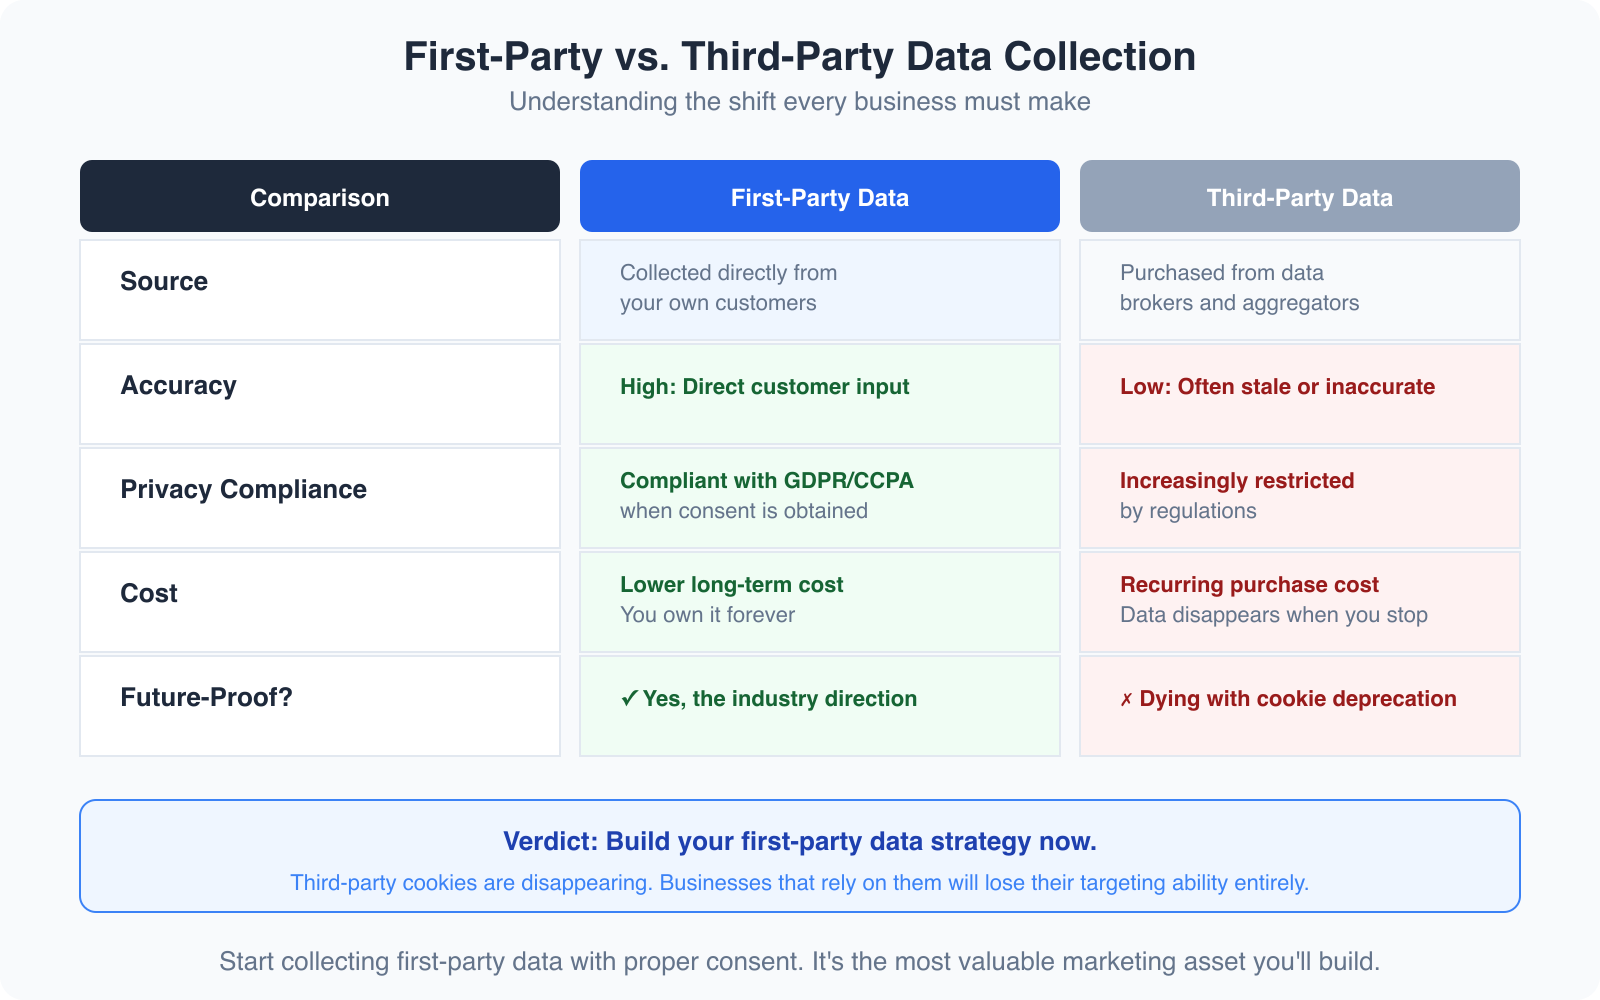
Third-party cookies are dying. Browser tracking restrictions are tightening every year. Social media algorithms change without warning. But your email list? That’s yours. No algorithm update can take it away. No platform change can reduce its reach. First-party data, the data your audience gives you directly with their consent, is the foundation of every smart content business in 2026.
Your email list is the single most valuable first-party data asset you own. Every subscriber voluntarily gave you their contact information and permission to reach them. That’s worth more than 10,000 social media followers, because you control the relationship entirely. When I analyze revenue per channel across my sites, email consistently drives 3-5x more revenue per visitor than organic search traffic. The reason is simple: email subscribers already trust you enough to give you their inbox.
Building a first-party data strategy goes beyond just growing your email list, though. It means collecting zero-party data too: preferences, interests, and intentions that subscribers tell you directly. I use a simple onboarding sequence that asks new subscribers what topics they care most about, what their biggest challenge is, and whether they’re a beginner, intermediate, or advanced creator. This takes 3 emails spread across 2 weeks. The segmentation data I get back is worth more than any third-party audience profile I could buy.
Here’s how first-party data compares to the third-party data that used to dominate digital marketing. First-party data (email subscribers, GA4 events, purchase history, survey responses) is highly accurate because your audience provides it directly. You own it permanently. It’s compliant by design since it’s consent-based. And it costs almost nothing to collect. Third-party data (cookies, purchased email lists, rented audience segments from data brokers) has low and decaying accuracy. You’re renting it, so it disappears when the contract ends. It’s increasingly non-compliant with GDPR and CCPA. And it’s expensive with rising prices every year. The choice is obvious.
Simple A/B Testing for Content Creators
You don’t need expensive testing tools to run meaningful experiments on your content. The concept is straightforward: change one variable, measure the result, keep what works. I run A/B tests constantly, and most of them use free tools.
Email subject lines are the easiest place to start. Most email platforms let you split your list and test two subject lines against each other. I test every email send this way. Over 6 months, I’ve found that subject lines with specific numbers outperform vague ones by 22% on average. “5 tools I actually use for SEO” beats “My favorite SEO tools” every time. That’s the kind of data-driven insight that compounds over time.
For blog content, I test headlines by publishing with one title, measuring click-through rate from search results in Search Console for 2 weeks, then changing the title and measuring again. It’s not a perfect A/B test because timing and seasonality affect results, but it’s practical and free. I’ve improved click-through rates by 15-30% on several articles just by testing headline variations.
CTA placement is another high-impact test. I tracked affiliate link click rates on 20 articles where I moved the primary CTA from the bottom of the article to after the second H2 section. Click rates increased by an average of 45%. People don’t always scroll to the bottom. Put your best CTA where readers are most engaged, which GA4 scroll data tells you precisely. The point of testing isn’t to optimize everything. It’s to build instincts backed by data instead of guesses.
Data Privacy Basics Every Content Creator Needs
Privacy regulations aren’t just for big companies. If you collect email addresses, use analytics, or run affiliate links, you’re handling personal data. GDPR (Europe), CCPA (California), and similar laws in dozens of other jurisdictions apply to websites that reach users in those regions, regardless of where you’re based.
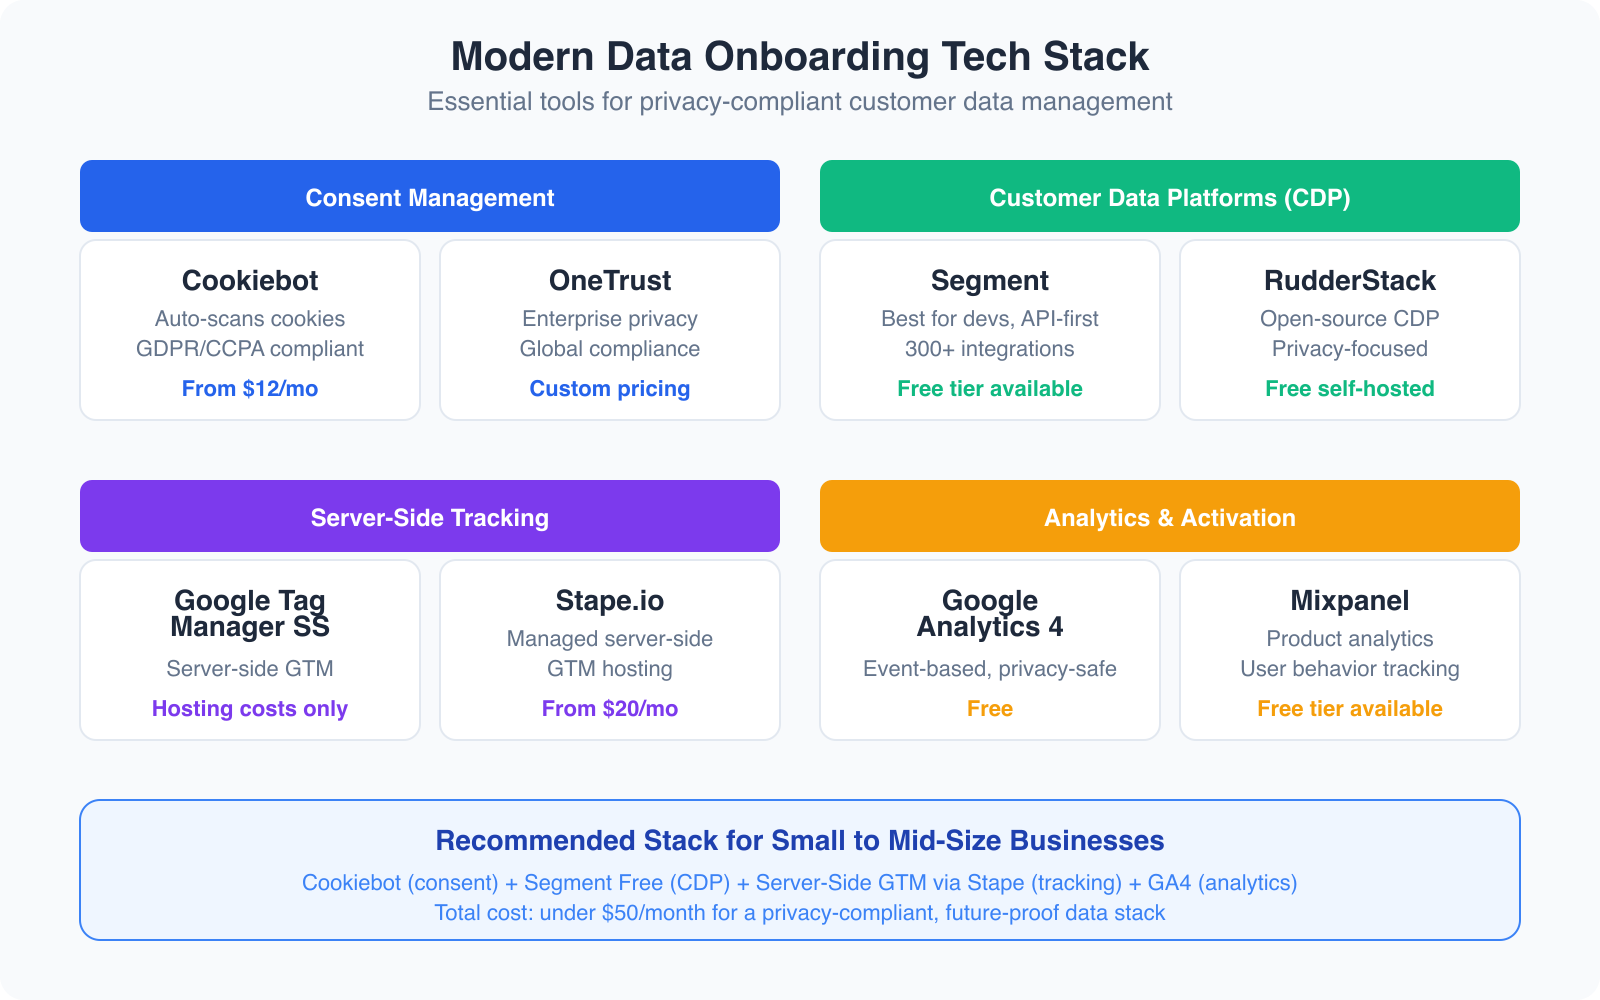
The good news: compliance for content creators is simpler than it sounds. You need a clear privacy policy that explains what data you collect and why. You need cookie consent that lets visitors opt in before non-essential tracking fires. You need to honor opt-out requests within 30 days. And you need to store data securely and not share it without consent. GA4 handles much of this by default. It doesn’t collect IP addresses (they’re anonymized), and it works with Google’s consent mode to respect user preferences. Your email platform should have double opt-in enabled, which documents consent automatically.
One thing I see content creators get wrong constantly: using tracking pixels and scripts without disclosing them. If you embed a YouTube video, Facebook pixel, or third-party widget, each of those sets cookies. Your privacy policy and cookie consent need to cover all of them. A free tool like CookieServe scans your site and lists every cookie being set. Run it quarterly.
Best Tools for Content Analytics and Data Onboarding
You don’t need 15 tools. You need the right 3-4 that cover your actual needs. After testing dozens of analytics and data tools over the years, here’s what I actually use and recommend for content creators who want to make data-driven decisions without drowning in dashboards.
Semrush is my primary tool for SEO and content performance analytics. It tracks keyword rankings daily, audits existing content for optimization opportunities, shows competitor traffic patterns, and identifies content gaps I should fill. The Content Analyzer feature specifically connects search performance to individual articles, which makes content ROI analysis much easier. Plans start at $139.95/month but the free trial gives you enough time to see the value. For content creators serious about tracking content marketing KPIs, it’s the most complete solution.
Monday.com works as both a project management tool and a simple content analytics dashboard. I use it to track my editorial calendar, content production pipeline, and performance metrics in one workspace. The dashboards let you create custom views that pull data from your content tracking columns, so you can see at a glance which articles are published, which are in progress, and how each is performing against goals. It’s also where I manage my weekly, monthly, and quarterly review tasks so nothing falls through the cracks. Plans start free for individuals.
Google Workspace is the backbone of my data onboarding setup. Google Sheets serves as my central data hub where I combine exports from GA4, Search Console, email platforms, and affiliate networks into unified reports. Google Looker Studio (formerly Data Studio) connects directly to GA4 and Search Console to create automated dashboards that update daily. And Gmail plus Google Calendar keep the review cadence on schedule. The Business Starter plan at $7/month per user includes everything you need.
- Custom dashboards for content performance tracking
- Editorial calendar with status automation
- 200+ integrations including Google Analytics
- Workload management for content teams
- Time tracking built into every board
- Free for individuals, paid plans from $9/seat/month
Project management platform that doubles as a content analytics dashboard. Track your editorial calendar, content pipeline, and performance metrics in one workspace with custom views and automations.

- Looker Studio connects directly to GA4 and Search Console
- Google Sheets works as a central data hub
- 15 GB storage per user on starter plan
- Custom email domain for professional branding
- Native integration with all Google analytics tools
- Business Starter plan at $7/month per user
The backbone of any content creator’s data setup. Sheets for combining data exports, Looker Studio for automated dashboards, Gmail for subscriber communication, and Drive for organized storage. Everything connects to GA4 natively.
Beyond these three, GA4 (free) and Google Search Console (free) are non-negotiable. Every content creator should have both set up and configured properly. And your email platform’s built-in analytics cover the email side. The total cost of this stack, assuming you already have an email platform, is under $160/month. That’s less than most people spend on tools they barely use.
Which analytics tool do you rely on most?
Common Data Mistakes Content Creators Make
I’ve made most of these mistakes myself, which is how I know they’re common. Avoiding them will save you months of wasted effort and thousands of dollars in missed opportunities.
Tracking everything, analyzing nothing. Installing 8 analytics tools and checking none of them regularly is worse than having no analytics at all. It creates a false sense of being “data-driven” when you’re actually making gut decisions. Pick 3-4 tools maximum and check them on the cadence I described above. More data isn’t better. More useful data is better.
Optimizing for traffic instead of revenue. I spent two years chasing page views before I realized that my highest-traffic articles generated almost no revenue, while quieter articles with 1/10 the traffic earned 5x more through affiliate commissions. Traffic is a vanity metric unless you connect it to revenue. That’s the entire point of data onboarding. Check your online marketing strategies against actual revenue data, not just traffic charts.
Ignoring data quality. Duplicate GA4 events, misconfigured goals, broken UTM parameters, and unverified email addresses all corrupt your data. I run a data quality check monthly: verify GA4 is tracking correctly using the real-time report, check for duplicate events in the DebugView, and clean my email list of bounces and inactive subscribers. Bad data leads to bad decisions. It’s that simple.
Making decisions from too little data. One article going viral doesn’t mean you should pivot your entire content strategy. One email with a low open rate doesn’t mean your list is dead. Wait for patterns across at least 4-6 weeks of data before making strategic changes. Statistical significance matters even when you’re not running formal experiments.
Not connecting the full funnel. Looking at traffic without looking at conversions. Looking at email opens without looking at clicks. Looking at affiliate clicks without looking at commissions. Every metric is part of a funnel, and optimization happens by finding where the funnel leaks, not by celebrating the top of it. Build your dashboard to show the complete journey: traffic to engagement to conversion to revenue.
Copying competitor strategies without their data. Just because a competitor publishes daily doesn’t mean you should. They might have data showing daily publishing works for their audience. Your audience might be completely different. Use your own data to make your own decisions. That’s the whole point of creating content strategically instead of reactively.
Building Your Data Onboarding System Step by Step
Here’s the exact sequence I’d follow if I were starting from scratch. Each step builds on the previous one. Don’t skip ahead.
Week 1: Set up GA4 properly. Configure enhanced measurement (scroll tracking, outbound clicks, site search, file downloads). Create custom events for affiliate link clicks and email signups via Google Tag Manager. Set up 4 audience segments: converters, engaged readers, email subscribers, and returning visitors. Verify everything works in the real-time report.
Week 2: Connect Search Console and set up UTM tracking. Link Search Console to GA4. Create your UTM parameter naming convention and document it. Set up UTM templates for every channel you use (email, social, guest posts). Add sub-ID tracking to your affiliate links.
Week 3: Build your central dashboard. Create a Google Looker Studio dashboard that pulls from GA4 and Search Console. Add a Google Sheet that combines your email platform exports, affiliate reports, and ad revenue data. This is your “single source of truth” for content performance. Make sure it answers: what’s working, what’s not, and what’s making money.
Week 4: Establish your review cadence. Block 15 minutes every Monday for your weekly check. Schedule a 1-hour monthly review on the first Monday of each month. Book a 3-hour quarterly deep dive. Set up reminders and create a checklist for each review. The system only works if you actually use it consistently.
Week 5 and beyond: Optimize based on data. Now you have the data flowing and a cadence for reviewing it. Start making decisions based on what the numbers tell you. Update your best-performing content. Drop topics that get traffic but no revenue. Double down on content clusters that convert. Reallocate your content budget based on actual ROI data instead of gut feelings.
Making Data Work for Your Content Business
Data onboarding for content creators isn’t about enterprise software or complex data pipelines. It’s about connecting the data you already have so you can see the full picture. GA4 shows you what happens on your site. Search Console shows you how people find you. Your email platform shows you who your most engaged audience members are. Your revenue data shows you what actually pays the bills. Connected, these data sources tell a story that no single tool can tell alone.
The content creators who thrive aren’t the ones who publish most. They’re the ones who know which content works and why. They’re the ones who can look at their dashboard and say “this article generated $2,400 in affiliate revenue last quarter because it attracts high-intent readers from specific search queries, and I should write more content like it.” That level of clarity only comes from connected data.
Start with GA4 setup this week. Add UTM tracking next week. Build your dashboard the week after. Within a month, you’ll have more actionable insight into your content business than most creators accumulate in a year. The tools are free or nearly free. The data is already there. You just need to connect the dots.
Frequently Asked Questions
What is data onboarding for content creators?
Data onboarding for content creators is the process of connecting your scattered data sources (GA4, Search Console, email platform, social media analytics, affiliate dashboards, ad revenue reports) into a unified view. Instead of checking 6 different dashboards, you combine the data so you can see which content drives traffic, engagement, and revenue together. This lets you make smarter decisions about what to create, update, and promote.
Do I need expensive tools for data onboarding?
No. The core stack is mostly free. GA4 and Google Search Console are free. Google Looker Studio for dashboards is free. Google Sheets for combining data exports is free or included in Google Workspace at $7/month. Your email platform’s built-in analytics are included in your subscription. The only paid tool I recommend for most content creators is Semrush for SEO analytics, which starts at $139.95/month with a free trial. Total cost: under $160/month for a complete data onboarding setup.
How long does it take to set up a content analytics dashboard?
About 4-5 weeks if you follow a structured approach. Week 1: configure GA4 with custom events and audience segments. Week 2: connect Search Console and set up UTM tracking. Week 3: build your central dashboard in Looker Studio and Google Sheets. Week 4: establish your weekly, monthly, and quarterly review cadence. After the initial setup, the weekly check takes just 15 minutes.
What is first-party data and why does it matter?
First-party data is information your audience gives you directly with their consent: email addresses, survey responses, purchase history, GA4 behavioral data, and form submissions. It matters because third-party data (cookies, purchased lists, rented audience segments) is dying due to privacy regulations like GDPR and CCPA and browser tracking restrictions. First-party data is more accurate, fully compliant, free to collect, and owned by you permanently. Your email list is the most valuable first-party data asset you have.
What is the most important metric for content creators to track?
Revenue per article. Traffic and page views are vanity metrics unless you connect them to actual income. Knowing that Article A gets 50,000 views but generates $20 in revenue while Article B gets 5,000 views but generates $500 changes your entire content strategy. Use UTM parameters, affiliate sub-IDs, and GA4 conversion tracking to connect traffic data to revenue data for every piece of content you publish.
How often should I check my content analytics?
Use a three-tier cadence. Weekly (15 minutes): check traffic snapshot, top pages, email metrics, social engagement, and revenue. Monthly (1 hour): do a full content audit, review keyword rankings, analyze email list health, break down revenue by channel, and assess your conversion funnel. Quarterly (3 hours): analyze content ROI, review audience growth trends, evaluate topic cluster performance, check revenue diversification, and plan next quarter’s strategy.
What are UTM parameters and how do I use them?
UTM parameters are tags you add to URLs that tell GA4 where traffic came from. They include source (the platform, like newsletter or twitter), medium (the type, like email or social), and campaign (the specific content, like march-roundup). Use Google’s free Campaign URL Builder to generate UTM links. Add them to every link you share outside your website: email links, social posts, guest articles, and forum posts. GA4 then shows you exactly which campaigns drive traffic and conversions.
Do content creators need to worry about data privacy regulations?
Yes. If you collect email addresses, use analytics tracking, or run affiliate links, you’re handling personal data. GDPR, CCPA, and similar regulations apply to websites that reach users in those jurisdictions, regardless of where you’re based. The basics: have a clear privacy policy, enable cookie consent before non-essential tracking fires, honor opt-out requests within 30 days, use double opt-in for email, and disclose all cookies and tracking scripts. GA4 handles IP anonymization by default, and most email platforms support double opt-in natively.
Disclaimer: This site is reader-supported. If you buy through some links, I may earn a small commission at no extra cost to you. I only recommend tools I trust and would use myself. Your support helps keep gauravtiwari.org free and focused on real-world advice. Thanks. - Gaurav Tiwari